User's Manual - Cornell Lab of Ornithology - Cornell University
User's Manual - Cornell Lab of Ornithology - Cornell University
User's Manual - Cornell Lab of Ornithology - Cornell University

You also want an ePaper? Increase the reach of your titles
YUMPU automatically turns print PDFs into web optimized ePapers that Google loves.
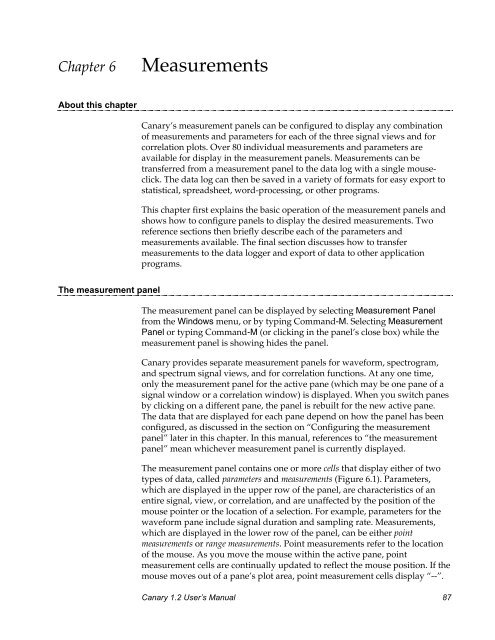
Chapter 6MeasurementsAbout this chapterCanary’s measurement panels can be configured to display any combination<strong>of</strong> measurements and parameters for each <strong>of</strong> the three signal views and forcorrelation plots. Over 80 individual measurements and parameters areavailable for display in the measurement panels. Measurements can betransferred from a measurement panel to the data log with a single mouseclick.The data log can then be saved in a variety <strong>of</strong> formats for easy export tostatistical, spreadsheet, word-processing, or other programs.This chapter first explains the basic operation <strong>of</strong> the measurement panels andshows how to configure panels to display the desired measurements. Tworeference sections then briefly describe each <strong>of</strong> the parameters andmeasurements available. The final section discusses how to transfermeasurements to the data logger and export <strong>of</strong> data to other applicationprograms.The measurement panelThe measurement panel can be displayed by selecting Measurement Panelfrom the Windows menu, or by typing Command-M. Selecting MeasurementPanel or typing Command-M (or clicking in the panel’s close box) while themeasurement panel is showing hides the panel.Canary provides separate measurement panels for waveform, spectrogram,and spectrum signal views, and for correlation functions. At any one time,only the measurement panel for the active pane (which may be one pane <strong>of</strong> asignal window or a correlation window) is displayed. When you switch panesby clicking on a different pane, the panel is rebuilt for the new active pane.The data that are displayed for each pane depend on how the panel has beenconfigured, as discussed in the section on “Configuring the measurementpanel” later in this chapter. In this manual, references to “the measurementpanel” mean whichever measurement panel is currently displayed.The measurement panel contains one or more cells that display either <strong>of</strong> twotypes <strong>of</strong> data, called parameters and measurements (Figure 6.1). Parameters,which are displayed in the upper row <strong>of</strong> the panel, are characteristics <strong>of</strong> anentire signal, view, or correlation, and are unaffected by the position <strong>of</strong> themouse pointer or the location <strong>of</strong> a selection. For example, parameters for thewaveform pane include signal duration and sampling rate. Measurements,which are displayed in the lower row <strong>of</strong> the panel, can be either pointmeasurements or range measurements. Point measurements refer to the location<strong>of</strong> the mouse. As you move the mouse within the active pane, pointmeasurement cells are continually updated to reflect the mouse position. If themouse moves out <strong>of</strong> a pane’s plot area, point measurement cells display “--”.Canary 1.2 User’s <strong>Manual</strong> 87