User's Manual - Cornell Lab of Ornithology - Cornell University
User's Manual - Cornell Lab of Ornithology - Cornell University
User's Manual - Cornell Lab of Ornithology - Cornell University

Create successful ePaper yourself
Turn your PDF publications into a flip-book with our unique Google optimized e-Paper software.
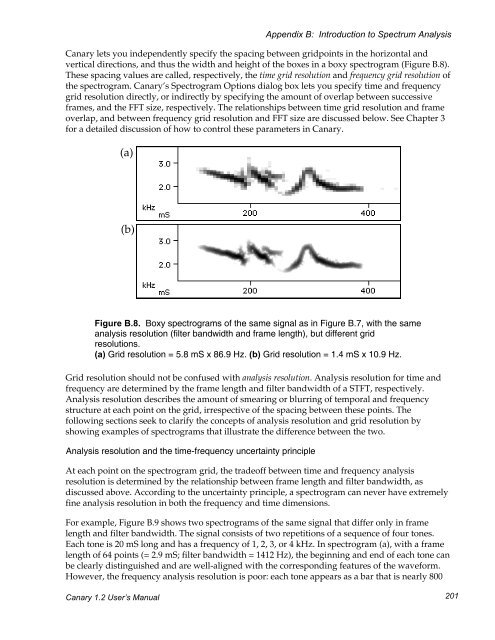
Appendix B: Introduction to Spectrum AnalysisCanary lets you independently specify the spacing between gridpoints in the horizontal andvertical directions, and thus the width and height <strong>of</strong> the boxes in a boxy spectrogram (Figure B.8).These spacing values are called, respectively, the time grid resolution and frequency grid resolution <strong>of</strong>the spectrogram. Canary’s Spectrogram Options dialog box lets you specify time and frequencygrid resolution directly, or indirectly by specifying the amount <strong>of</strong> overlap between successiveframes, and the FFT size, respectively. The relationships between time grid resolution and frameoverlap, and between frequency grid resolution and FFT size are discussed below. See Chapter 3for a detailed discussion <strong>of</strong> how to control these parameters in Canary.(a)(b)Figure B.8. Boxy spectrograms <strong>of</strong> the same signal as in Figure B.7, with the sameanalysis resolution (filter bandwidth and frame length), but different gridresolutions.(a) Grid resolution = 5.8 mS x 86.9 Hz. (b) Grid resolution = 1.4 mS x 10.9 Hz.Grid resolution should not be confused with analysis resolution. Analysis resolution for time andfrequency are determined by the frame length and filter bandwidth <strong>of</strong> a STFT, respectively.Analysis resolution describes the amount <strong>of</strong> smearing or blurring <strong>of</strong> temporal and frequencystructure at each point on the grid, irrespective <strong>of</strong> the spacing between these points. Thefollowing sections seek to clarify the concepts <strong>of</strong> analysis resolution and grid resolution byshowing examples <strong>of</strong> spectrograms that illustrate the difference between the two.Analysis resolution and the time-frequency uncertainty principleAt each point on the spectrogram grid, the trade<strong>of</strong>f between time and frequency analysisresolution is determined by the relationship between frame length and filter bandwidth, asdiscussed above. According to the uncertainty principle, a spectrogram can never have extremelyfine analysis resolution in both the frequency and time dimensions.For example, Figure B.9 shows two spectrograms <strong>of</strong> the same signal that differ only in framelength and filter bandwidth. The signal consists <strong>of</strong> two repetitions <strong>of</strong> a sequence <strong>of</strong> four tones.Each tone is 20 mS long and has a frequency <strong>of</strong> 1, 2, 3, or 4 kHz. In spectrogram (a), with a framelength <strong>of</strong> 64 points (= 2.9 mS; filter bandwidth = 1412 Hz), the beginning and end <strong>of</strong> each tone canbe clearly distinguished and are well-aligned with the corresponding features <strong>of</strong> the waveform.However, the frequency analysis resolution is poor: each tone appears as a bar that is nearly 800Canary 1.2 User’s <strong>Manual</strong> 201