- Page 1 and 2:
CanaryThe Cornell Bioacoustics Work
- Page 3 and 4:
ContentsPreface Welcome to Canary 1
- Page 5 and 6:
The recording buffer; recording tim
- Page 7 and 8:
Chapter 6 Measurements ............
- Page 9 and 10:
Dialog fields, checkboxes, and butt
- Page 11 and 12:
Preface Welcome to Canary 1.2What C
- Page 13 and 14:
Chapter 1: Getting StartedSpectrum
- Page 15 and 16:
Chapter 1: Getting StartedSoftwareC
- Page 17 and 18:
Chapter 1Getting StartedAbout this
- Page 19 and 20:
Chapter 1: Getting StartedFigure 1.
- Page 21 and 22:
Chapter 1: Getting StartedPlaying b
- Page 23 and 24:
Chapter 1: Getting Startedspectrogr
- Page 25 and 26:
Chapter 1: Getting StartedAdjusting
- Page 27 and 28:
Chapter 1: Getting StartedZooming i
- Page 29 and 30:
Chapter 1: Getting StartedFigure 1.
- Page 31 and 32:
Chapter 1: Getting StartedIf you se
- Page 33 and 34:
Chapter 1: Getting StartedCouplingo
- Page 35 and 36:
Chapter 1: Getting StartedSaving lo
- Page 37 and 38:
Chapter 1: Getting StartedFigure 1.
- Page 39 and 40:
Chapter 1: Getting Started(a)(b)Fig
- Page 41 and 42:
Chapter 1: Getting StartedWhen more
- Page 43 and 44:
Chapter 1: Getting StartedRecording
- Page 45 and 46:
Chapter 2Signal AcquisitionAbout th
- Page 47 and 48:
Chapter 2: Signal AcquisitionOption
- Page 49 and 50:
Chapter 2: Signal AcquisitionSettin
- Page 51 and 52:
Chapter 2: Signal AcquisitionContin
- Page 53 and 54:
Chapter 3Spectrum AnalysisAbout thi
- Page 55 and 56:
Chapter 3: Spectrum AnalysisAnalysi
- Page 57 and 58:
Chapter 3: Spectrum AnalysisGrid re
- Page 59 and 60:
Chapter 3: Spectrum AnalysisRemembe
- Page 61 and 62:
Chapter 3: Spectrum AnalysisFor a g
- Page 63 and 64:
Chapter 3: Spectrum Analysisbe nois
- Page 65 and 66:
Chapter 3: Spectrum AnalysisLogarit
- Page 67 and 68:
Chapter 3: Spectrum AnalysisNamed o
- Page 69 and 70:
Chapter 3: Spectrum AnalysisSpectro
- Page 71 and 72:
Chapter 3: Spectrum AnalysisBoxy vs
- Page 73 and 74:
Chapter 3: Spectrum AnalysisTime an
- Page 75 and 76:
Chapter 3: Spectrum AnalysisSelecti
- Page 77 and 78:
Chapter 4Signal Amplitude Calibrati
- Page 79 and 80:
Chapter 4: Amplitude Calibrationper
- Page 81 and 82:
Chapter 4: Amplitude CalibrationIt
- Page 83 and 84:
Chapter 4: Amplitude CalibrationSel
- Page 85 and 86:
Chapter 4: Amplitude CalibrationAir
- Page 87:
Chapter 4: Amplitude Calibrationrec
- Page 90 and 91:
Chapter 5: Multi-track DocumentsThe
- Page 92 and 93:
Chapter 5: Multi-track DocumentsDis
- Page 94 and 95:
Chapter 5: Multi-track Documentson
- Page 97 and 98:
Chapter 6MeasurementsAbout this cha
- Page 99 and 100:
Chapter 6: MeasurementsThe radio bu
- Page 101 and 102:
Chapter 6: Measurementscorrelated,
- Page 103 and 104:
Chapter 6: MeasurementsAmplitude Fl
- Page 105 and 106:
⎛⎜⎜⎝t 2∑f 2∑t=t 1 f = f
- Page 107 and 108:
Chapter 6: Measurements(Point) For
- Page 109 and 110:
Chapter 6: Measurements(Range) The
- Page 111 and 112:
Chapter 6: MeasurementsYou can clos
- Page 113 and 114:
Chapter 6: MeasurementsDeleting ent
- Page 115:
Chapter 6: MeasurementsSyllable dur
- Page 118 and 119:
Chapter 7: Correlation(a)(b)(c)peak
- Page 120 and 121:
Chapter 7: CorrelationWaveformcorre
- Page 122 and 123:
Chapter 7: CorrelationFigure 7.4. T
- Page 124 and 125:
Chapter 7: Correlationselected, but
- Page 126 and 127:
Chapter 7: CorrelationSpectrogram c
- Page 128 and 129:
Chapter 7: CorrelationLogarithmic v
- Page 130 and 131:
Chapter 7: CorrelationWaveform corr
- Page 133 and 134:
Chapter 8Preferences and OptionsAbo
- Page 135 and 136:
Chapter 8: Preferences and OptionsR
- Page 137 and 138:
Chapter 8: Preferences and OptionsS
- Page 139 and 140:
Chapter 8: Preferences and OptionsF
- Page 141:
Chapter 8: Preferences and OptionsF
- Page 144 and 145:
Chapter 9: Printing and Graphics Ex
- Page 146 and 147:
Chapter 9: Printing and Graphics Ex
- Page 148 and 149:
Chapter 10: File FormatsTable 10.1.
- Page 150 and 151:
Chapter 10: File FormatsFigure 10.3
- Page 152 and 153:
Chapter 10: File FormatsWhen saving
- Page 155 and 156: Chapter 11Batch ProcessingAbout thi
- Page 157 and 158: Chapter 11: Batch ProcessingFigure
- Page 159 and 160: Chapter 11: Batch ProcessingInput s
- Page 161 and 162: Chapter 11: Batch ProcessingCorrela
- Page 163 and 164: Chapter 11: Batch ProcessingThe cor
- Page 165 and 166: Chapter 11: Batch ProcessingWhen ma
- Page 167: Chapter 11: Batch ProcessingFigure
- Page 170 and 171: Chapter 12: Referencesound data. Th
- Page 172 and 173: Chapter 12: ReferenceFile / Save Pr
- Page 174 and 175: Chapter 12: Referencemeasurement pa
- Page 176 and 177: Chapter 12: Referencewhich spectrog
- Page 178 and 179: Chapter 12: Referencematches any fi
- Page 180 and 181: Chapter 12: Referencecannot display
- Page 182 and 183: Chapter 12: ReferenceRecord dialog
- Page 184 and 185: Chapter 12: ReferenceSave Text Repo
- Page 186 and 187: Chapter 12: ReferenceaW/m 2 (the va
- Page 188 and 189: Chapter 12: Referencethey are not s
- Page 190 and 191: Chapter 12: ReferenceSpectrogram /
- Page 192 and 193: Chapter 12: ReferenceCommand Panel:
- Page 194 and 195: Chapter 12: ReferenceCommand Panel:
- Page 197 and 198: Appendix A Digital Representation o
- Page 199 and 200: Appendix A: Digital Sound(a)(b)Figu
- Page 201: Appendix A: Digital SoundSan Franci
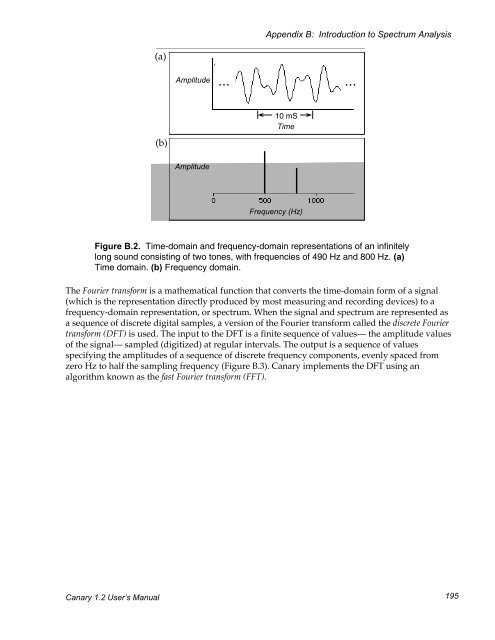
- Page 206 and 207: Appendix B: Introduction to Spectru
- Page 208 and 209: Appendix B: Introduction to Spectru
- Page 210 and 211: Appendix B: Introduction to Spectru
- Page 212 and 213: Appendix B: Introduction to Spectru
- Page 214 and 215: Appendix B: Introduction to Spectru
- Page 216 and 217: Appendix B: Introduction to Spectru
- Page 218 and 219: Appendix B: Introduction to Spectru
- Page 220 and 221: Appendix B: Introduction to Spectru
- Page 223 and 224: Appendix C Sound Amplitude Measurem
- Page 225 and 226: Appendix C: Sound Amplitude Measure
- Page 227: c = 331.4 1 + T273Appendix C: Sound
- Page 230 and 231: Appendix D: TroubleshootingFigure D
- Page 232 and 233: Appendix D: Troubleshooting4. Quit
- Page 234 and 235: Appendix D: TroubleshootingNote: Th
- Page 236 and 237: Appendix D: Troubleshootinghardware
- Page 239 and 240: Appendix F Using the Macintosh Buil
- Page 241: Appendix F: Macintosh Sound Inputto
- Page 244 and 245: Energy measurement in the spectrogr
- Page 246 and 247: Figure 1: Atypical plot of [i] 2 ,
- Page 248 and 249: whereN f ;1X= n=0N2 X;1k=0XN= E ~
- Page 250 and 251: Normalized correlationsCanary's nor
- Page 252 and 253: in power or energy. The conversion
- Page 254 and 255:
Impedance parameter,. see Calibrati
- Page 256 and 257:
SoundEdit, 143, 185 Impedance, 69Te
- Page 258 and 259:
Paste command (Edit menu), 26, 160R
- Page 260 and 261:
hard-copy, 133 magnitude, 194FFT si