User's Manual - Cornell Lab of Ornithology - Cornell University
User's Manual - Cornell Lab of Ornithology - Cornell University
User's Manual - Cornell Lab of Ornithology - Cornell University

You also want an ePaper? Increase the reach of your titles
YUMPU automatically turns print PDFs into web optimized ePapers that Google loves.
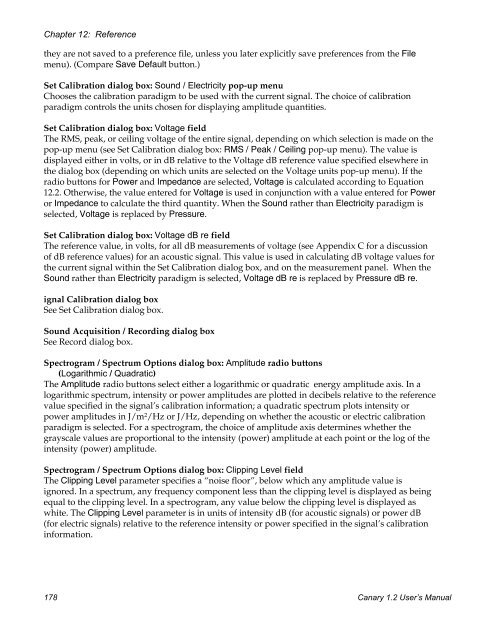
Chapter 12: Referencethey are not saved to a preference file, unless you later explicitly save preferences from the Filemenu). (Compare Save Default button.)Set Calibration dialog box: Sound / Electricity pop-up menuChooses the calibration paradigm to be used with the current signal. The choice <strong>of</strong> calibrationparadigm controls the units chosen for displaying amplitude quantities.Set Calibration dialog box: Voltage fieldThe RMS, peak, or ceiling voltage <strong>of</strong> the entire signal, depending on which selection is made on thepop-up menu (see Set Calibration dialog box: RMS / Peak / Ceiling pop-up menu). The value isdisplayed either in volts, or in dB relative to the Voltage dB reference value specified elsewhere inthe dialog box (depending on which units are selected on the Voltage units pop-up menu). If theradio buttons for Power and Impedance are selected, Voltage is calculated according to Equation12.2. Otherwise, the value entered for Voltage is used in conjunction with a value entered for Poweror Impedance to calculate the third quantity. When the Sound rather than Electricity paradigm isselected, Voltage is replaced by Pressure.Set Calibration dialog box: Voltage dB re fieldThe reference value, in volts, for all dB measurements <strong>of</strong> voltage (see Appendix C for a discussion<strong>of</strong> dB reference values) for an acoustic signal. This value is used in calculating dB voltage values forthe current signal within the Set Calibration dialog box, and on the measurement panel. When theSound rather than Electricity paradigm is selected, Voltage dB re is replaced by Pressure dB re.ignal Calibration dialog boxSee Set Calibration dialog box.Sound Acquisition / Recording dialog boxSee Record dialog box.Spectrogram / Spectrum Options dialog box: Amplitude radio buttons(Logarithmic / Quadratic)The Amplitude radio buttons select either a logarithmic or quadratic energy amplitude axis. In alogarithmic spectrum, intensity or power amplitudes are plotted in decibels relative to the referencevalue specified in the signal’s calibration information; a quadratic spectrum plots intensity orpower amplitudes in J/m 2 /Hz or J/Hz, depending on whether the acoustic or electric calibrationparadigm is selected. For a spectrogram, the choice <strong>of</strong> amplitude axis determines whether thegrayscale values are proportional to the intensity (power) amplitude at each point or the log <strong>of</strong> theintensity (power) amplitude.Spectrogram / Spectrum Options dialog box: Clipping Level fieldThe Clipping Level parameter specifies a “noise floor”, below which any amplitude value isignored. In a spectrum, any frequency component less than the clipping level is displayed as beingequal to the clipping level. In a spectrogram, any value below the clipping level is displayed aswhite. The Clipping Level parameter is in units <strong>of</strong> intensity dB (for acoustic signals) or power dB(for electric signals) relative to the reference intensity or power specified in the signal’s calibrationinformation.178 Canary 1.2 User’s <strong>Manual</strong>