User's Manual - Cornell Lab of Ornithology - Cornell University
User's Manual - Cornell Lab of Ornithology - Cornell University
User's Manual - Cornell Lab of Ornithology - Cornell University
Create successful ePaper yourself
Turn your PDF publications into a flip-book with our unique Google optimized e-Paper software.
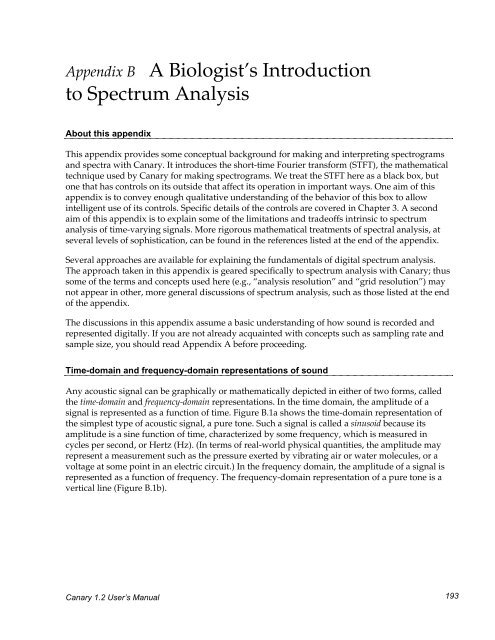
Appendix B A Biologist’s Introductionto Spectrum AnalysisAbout this appendixThis appendix provides some conceptual background for making and interpreting spectrogramsand spectra with Canary. It introduces the short-time Fourier transform (STFT), the mathematicaltechnique used by Canary for making spectrograms. We treat the STFT here as a black box, butone that has controls on its outside that affect its operation in important ways. One aim <strong>of</strong> thisappendix is to convey enough qualitative understanding <strong>of</strong> the behavior <strong>of</strong> this box to allowintelligent use <strong>of</strong> its controls. Specific details <strong>of</strong> the controls are covered in Chapter 3. A secondaim <strong>of</strong> this appendix is to explain some <strong>of</strong> the limitations and trade<strong>of</strong>fs intrinsic to spectrumanalysis <strong>of</strong> time-varying signals. More rigorous mathematical treatments <strong>of</strong> spectral analysis, atseveral levels <strong>of</strong> sophistication, can be found in the references listed at the end <strong>of</strong> the appendix.Several approaches are available for explaining the fundamentals <strong>of</strong> digital spectrum analysis.The approach taken in this appendix is geared specifically to spectrum analysis with Canary; thussome <strong>of</strong> the terms and concepts used here (e.g., “analysis resolution” and “grid resolution”) maynot appear in other, more general discussions <strong>of</strong> spectrum analysis, such as those listed at the end<strong>of</strong> the appendix.The discussions in this appendix assume a basic understanding <strong>of</strong> how sound is recorded andrepresented digitally. If you are not already acquainted with concepts such as sampling rate andsample size, you should read Appendix A before proceeding.Time-domain and frequency-domain representations <strong>of</strong> soundAny acoustic signal can be graphically or mathematically depicted in either <strong>of</strong> two forms, calledthe time-domain and frequency-domain representations. In the time domain, the amplitude <strong>of</strong> asignal is represented as a function <strong>of</strong> time. Figure B.1a shows the time-domain representation <strong>of</strong>the simplest type <strong>of</strong> acoustic signal, a pure tone. Such a signal is called a sinusoid because itsamplitude is a sine function <strong>of</strong> time, characterized by some frequency, which is measured incycles per second, or Hertz (Hz). (In terms <strong>of</strong> real-world physical quantities, the amplitude mayrepresent a measurement such as the pressure exerted by vibrating air or water molecules, or avoltage at some point in an electric circuit.) In the frequency domain, the amplitude <strong>of</strong> a signal isrepresented as a function <strong>of</strong> frequency. The frequency-domain representation <strong>of</strong> a pure tone is avertical line (Figure B.1b).Canary 1.2 User’s <strong>Manual</strong> 193


