the gauteng spatial development framework - Gauteng Online
the gauteng spatial development framework - Gauteng Online
the gauteng spatial development framework - Gauteng Online

Create successful ePaper yourself
Turn your PDF publications into a flip-book with our unique Google optimized e-Paper software.
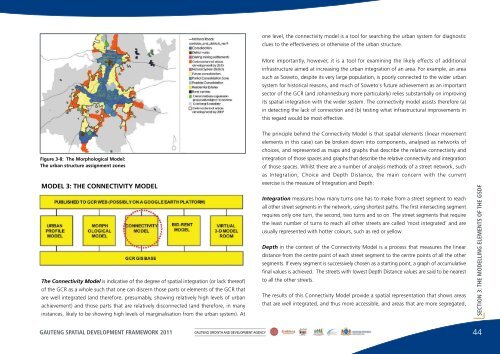
one level, <strong>the</strong> connectivity model is a tool for searching <strong>the</strong> urban system for diagnosticclues to <strong>the</strong> effectiveness or o<strong>the</strong>rwise of <strong>the</strong> urban structure.More importantly, however, it is a tool for examining <strong>the</strong> likely effects of additionalinfrastructure aimed at increasing <strong>the</strong> urban integration of an area. For example, an areasuch as Soweto, despite its very large population, is poorly connected to <strong>the</strong> wider urbansystem for historical reasons, and much of Soweto's future achievement as an importantsector of <strong>the</strong> GCR (and Johannesburg more particularly) relies substantially on improvingits <strong>spatial</strong> integration with <strong>the</strong> wider system. The connectivity model assists <strong>the</strong>refore (a)in detecting <strong>the</strong> lack of connection and (b) testing what infrastructural improvements inthis regard would be most effective.Figure 3-8: The Morphological Model:The urban structure assignment zonesMODEL 3: THE CONNECTIVITY MODELThe Connectivity Model is indicative of <strong>the</strong> degree of <strong>spatial</strong> integration (or lack <strong>the</strong>reof)of <strong>the</strong> GCR as a whole such that one can discern those parts or elements of <strong>the</strong> GCR thatare well integrated (and <strong>the</strong>refore, presumably, showing relatively high levels of urbanachievement) and those parts that are relatively disconnected (and <strong>the</strong>refore, in manyinstances, likely to be showing high levels of marginalisation from <strong>the</strong> urban system). AtThe principle behind <strong>the</strong> Connectivity Model is that <strong>spatial</strong> elements (linear movementelements in this case) can be broken down into components, analysed as networks ofchoices, and represented as maps and graphs that describe <strong>the</strong> relative connectivity andintegration of those spaces and graphs that describe <strong>the</strong> relative connectivity and integrationof those spaces. Whilst <strong>the</strong>re are a number of analysis methods of a street network, suchas Integration, Choice and Depth Distance, <strong>the</strong> main concern with <strong>the</strong> currentexercise is <strong>the</strong> measure of Integration and Depth:Integration measures how many turns one has to make from a street segment to reachall o<strong>the</strong>r street segments in <strong>the</strong> network, using shortest paths. The first intersecting segmentrequires only one turn, <strong>the</strong> second, two turns and so on. The street segments that require<strong>the</strong> least number of turns to reach all o<strong>the</strong>r streets are called 'most integrated' and areusually represented with hotter colours, such as red or yellow.Depth in <strong>the</strong> context of <strong>the</strong> Connectivity Model is a process that measures <strong>the</strong> lineardistance from <strong>the</strong> centre point of each street segment to <strong>the</strong> centre points of all <strong>the</strong> o<strong>the</strong>rsegments. If every segment is successively chosen as a starting point, a graph of accumulativefinal values is achieved. The streets with lowest Depth Distance values are said to be nearestto all <strong>the</strong> o<strong>the</strong>r streets.The results of this Connectivity Model provide a <strong>spatial</strong> representation that shows areasthat are well integrated, and thus more accessible, and areas that are more segregated,SECTION 3: THE MODELLING ELEMENTS OF THE GSDFGAUTENG SPATIAL DEVELOPMENT FRAMEWORK 2011GAUTENG GROWTH AND DEVELOPMENT AGENCY44