Jackson2013-Status and Trendsof Caribbean Coral Reefs
Jackson2013-Status and Trendsof Caribbean Coral Reefs.pdf
Jackson2013-Status and Trendsof Caribbean Coral Reefs.pdf
Create successful ePaper yourself
Turn your PDF publications into a flip-book with our unique Google optimized e-Paper software.
PART II: REPORTS FOR<br />
INDIVIDUAL COUNTRIES<br />
AND TERRITORIES<br />
1. INTRODUCTION<br />
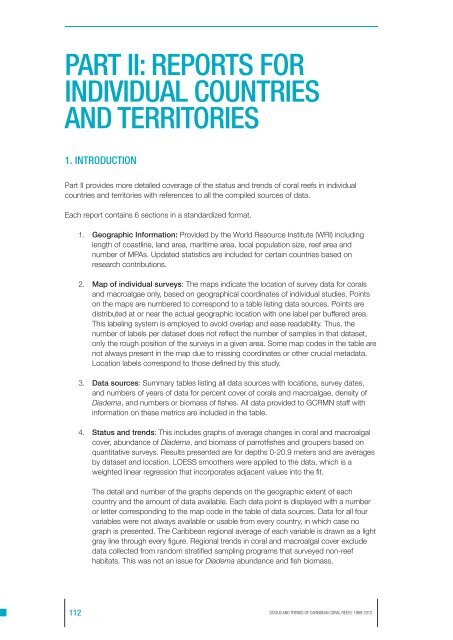
Part II provides more detailed coverage of the status <strong>and</strong> trends of coral reefs in individual<br />
countries <strong>and</strong> territories with references to all the compiled sources of data.<br />
Each report contains 6 sections in a st<strong>and</strong>ardized format.<br />
1. Geographic Information: Provided by the World Resource Institute (WRI) including<br />
length of coastline, l<strong>and</strong> area, maritime area, local population size, reef area <strong>and</strong><br />
number of MPAs. Updated statistics are included for certain countries based on<br />
research contributions.<br />
2. Map of individual surveys: The maps indicate the location of survey data for corals<br />
<strong>and</strong> macroalgae only, based on geographical coordinates of individual studies. Points<br />
on the maps are numbered to correspond to a table listing data sources. Points are<br />
distributed at or near the actual geographic location with one label per buffered area.<br />
This labeling system is employed to avoid overlap <strong>and</strong> ease readability. Thus, the<br />
number of labels per dataset does not reflect the number of samples in that dataset,<br />
only the rough position of the surveys in a given area. Some map codes in the table are<br />
not always present in the map due to missing coordinates or other crucial metadata.<br />
Location labels correspond to those defined by this study.<br />
3. Data sources: Summary tables listing all data sources with locations, survey dates,<br />
<strong>and</strong> numbers of years of data for percent cover of corals <strong>and</strong> macroalgae, density of<br />
Diadema, <strong>and</strong> numbers or biomass of fishes. All data provided to GCRMN staff with<br />
information on these metrics are included in the table.<br />
4. <strong>Status</strong> <strong>and</strong> trends: This includes graphs of average changes in coral <strong>and</strong> macroalgal<br />
cover, abundance of Diadema, <strong>and</strong> biomass of parrotfishes <strong>and</strong> groupers based on<br />
quantitative surveys. Results presented are for depths 0-20.9 meters <strong>and</strong> are averages<br />
by dataset <strong>and</strong> location. LOESS smoothers were applied to the data, which is a<br />
weighted linear regression that incorporates adjacent values into the fit.<br />
The detail <strong>and</strong> number of the graphs depends on the geographic extent of each<br />
country <strong>and</strong> the amount of data available. Each data point is displayed with a number<br />
or letter corresponding to the map code in the table of data sources. Data for all four<br />
variables were not always available or usable from every country, in which case no<br />
graph is presented. The <strong>Caribbean</strong> regional average of each variable is drawn as a light<br />
gray line through every figure. Regional trends in coral <strong>and</strong> macroalgal cover exclude<br />
data collected from r<strong>and</strong>om stratified sampling programs that surveyed non-reef<br />
habitats. This was not an issue for Diadema abundance <strong>and</strong> fish biomass,<br />
112 STATUS AND TRENDS OF CARIBBEAN CORAL REEFS: 1969-2012


