
Create successful ePaper yourself
Turn your PDF publications into a flip-book with our unique Google optimized e-Paper software.
ITEM 9. THE OFFER AND LISTING<br />
Offer and Listing Details<br />
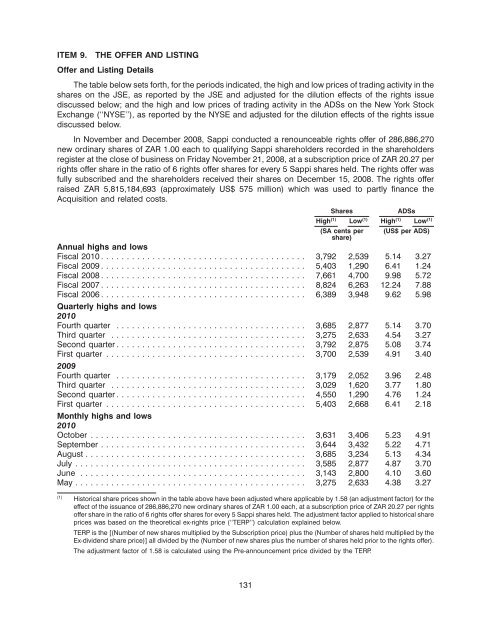
The table below sets forth, for the periods indicated, the high and low prices of trading activity in the<br />
shares on the JSE, as reported by the JSE and adjusted for the dilution effects of the rights issue<br />
discussed below; and the high and low prices of trading activity in the ADSs on the New York Stock<br />
Exchange (‘‘NYSE’’), as reported by the NYSE and adjusted for the dilution effects of the rights issue<br />
discussed below.<br />
In November and December 2008, Sappi conducted a renounceable rights offer of 286,886,270<br />
new ordinary shares of ZAR 1.00 each to qualifying Sappi shareholders recorded in the shareholders<br />
register at the close of business on Friday November 21, 2008, at a subscription price of ZAR 20.27 per<br />
rights offer share in the ratio of 6 rights offer shares for every 5 Sappi shares held. The rights offer was<br />
fully subscribed and the shareholders received their shares on December 15, 2008. The rights offer<br />
raised ZAR 5,815,184,693 (approximately US$ 575 million) which was used to partly finance the<br />
Acquisition and related costs.<br />
Shares ADSs<br />
High (1) Low (1) High (1) Low (1)<br />
(SA cents per<br />
share)<br />
(US$ per ADS)<br />
Annual highs and lows<br />
Fiscal 2010 ........................................ 3,792 2,539 5.14 3.27<br />
Fiscal 2009 ........................................ 5,403 1,290 6.41 1.24<br />
Fiscal 2008 ........................................ 7,661 4,700 9.98 5.72<br />
Fiscal 2007 ........................................ 8,824 6,263 12.24 7.88<br />
Fiscal 2006 ........................................<br />
Quarterly highs and lows<br />
2010<br />
6,389 3,948 9.62 5.98<br />
Fourth quarter ..................................... 3,685 2,877 5.14 3.70<br />
Third quarter ...................................... 3,275 2,633 4.54 3.27<br />
Second quarter ..................................... 3,792 2,875 5.08 3.74<br />
First quarter .......................................<br />
2009<br />
3,700 2,539 4.91 3.40<br />
Fourth quarter ..................................... 3,179 2,052 3.96 2.48<br />
Third quarter ...................................... 3,029 1,620 3.77 1.80<br />
Second quarter ..................................... 4,550 1,290 4.76 1.24<br />
First quarter .......................................<br />
Monthly highs and lows<br />
2010<br />
5,403 2,668 6.41 2.18<br />
October .......................................... 3,631 3,406 5.23 4.91<br />
September ........................................ 3,644 3,432 5.22 4.71<br />
August ........................................... 3,685 3,234 5.13 4.34<br />
July ............................................. 3,585 2,877 4.87 3.70<br />
June ............................................ 3,143 2,800 4.10 3.60<br />
May............................................. 3,275 2,633 4.38 3.27<br />
(1) Historical share prices shown in the table above have been adjusted where applicable by 1.58 (an adjustment factor) for the<br />
effect of the issuance of 286,886,270 new ordinary shares of ZAR 1.00 each, at a subscription price of ZAR 20.27 per rights<br />
offer share in the ratio of 6 rights offer shares for every 5 Sappi shares held. The adjustment factor applied to historical share<br />
prices was based on the theoretical ex-rights price (‘‘TERP’’) calculation explained below.<br />
TERP is the [(Number of new shares multiplied by the Subscription price) plus the (Number of shares held multiplied by the<br />
Ex-dividend share price)] all divided by the (Number of new shares plus the number of shares held prior to the rights offer).<br />
The adjustment factor of 1.58 is calculated using the Pre-announcement price divided by the TERP.<br />
131