- Page 1 and 2: As filed with the Securities and Ex
- Page 3 and 4: Item 7. Major Shareholders and Rela
- Page 5 and 6: References to ‘‘NBSK’’ are
- Page 7 and 8: PART I ITEM 1. IDENTITY OF DIRECTOR
- Page 9 and 10: Risk Factors In addition to other i
- Page 11 and 12: For further information, see ‘‘
- Page 13 and 14: terms of the debt being refinanced.
- Page 15 and 16: The inability to recover increasing
- Page 17 and 18: A large percentage of our employees
- Page 19 and 20: merge or consolidate with other com
- Page 21 and 22: we operate. The transaction was app
- Page 23 and 24: currencies as we can benefit from i
- Page 25 and 26: Major Product Categories Pulp: Desc
- Page 27: for coated mechanical paper decline
- Page 31 and 32: The following table sets out the ap
- Page 33 and 34: The following table sets forth sale
- Page 35 and 36: Kangas. As a direct result of the g
- Page 37 and 38: Customers Sappi Fine Paper sells it
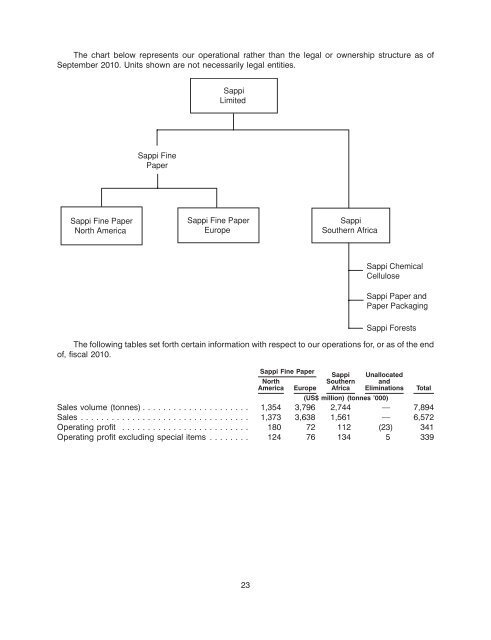
- Page 39 and 40: The following chart sets forth cert
- Page 41 and 42: Construction on the expansion proje
- Page 43 and 44: lease extendable to 2089. The locat
- Page 45 and 46: North America Wood In connection wi
- Page 47 and 48: Pulp Sappi Fine Paper Europe produc
- Page 49 and 50: ENVIRONMENTAL AND SAFETY MATTERS En
- Page 51 and 52: and management of forests are all r
- Page 53 and 54: ORGANIZATIONAL STRUCTURE Sappi Limi
- Page 55 and 56: Approximate Secured / Location Use
- Page 57 and 58: than we use. By region, the South A
- Page 59 and 60: ‘‘—Markets’’ for a furthe
- Page 61 and 62: '000 metric tonnes 8,000 7,000 6,00
- Page 63 and 64: The price of NBSK and Bleached Hard
- Page 65 and 66: ZAR/US$ 16.00 14.00 12.00 10.00 8.0
- Page 67 and 68: The fiscal period average three-mon
- Page 69 and 70: employees from the beginning of 200
- Page 71 and 72: The Sappi Southern Africa reportabl
- Page 73 and 74: Movements in operating profit and o
- Page 75 and 76: Operating profit in fiscal 2009 was
- Page 77 and 78: Sappi Southern Africa Key figures:
- Page 79 and 80:
Comparing fiscal 2010 with fiscal 2
- Page 81 and 82:
This comparison includes the closur
- Page 83 and 84:
African operations into the US doll
- Page 85 and 86:
Sappi Fine Paper North America Comp
- Page 87 and 88:
Taxation 2010 2009 (US$ million) 20
- Page 89 and 90:
elation to inventory levels and rec
- Page 91 and 92:
Capital expenditure by region is as
- Page 93 and 94:
Over the past three years the relat
- Page 95 and 96:
Group’s securitization programs,
- Page 97 and 98:
Credit Facility terminate on May 31
- Page 99 and 100:
quarters ending from January 2012 t
- Page 101 and 102:
As no default event has occurred, n
- Page 103 and 104:
In addition, Sappi Fine Paper North
- Page 105 and 106:
areas where our South African busin
- Page 107 and 108:
Recoveries in equity markets couple
- Page 109 and 110:
Impairment of assets other than goo
- Page 111 and 112:
The gains or losses, which are reco
- Page 113 and 114:
The Group’s policy is to recogniz
- Page 115 and 116:
ITEM 6. DIRECTORS, SENIOR MANAGEMEN
- Page 117 and 118:
Deenadayalen (Len) Konar Sappi boar
- Page 119 and 120:
Mohammed Valli (Valli) Moosa Other
- Page 121 and 122:
Rudolf Thummer Sappi board committe
- Page 123 and 124:
Executive Officers The Executive Di
- Page 125 and 126:
companies have to comply with domes
- Page 127 and 128:
average more than 45% of the employ
- Page 129 and 130:
For a detailed description of the S
- Page 131 and 132:
Pursuant to the Companies Amendment
- Page 133 and 134:
Post transaction shareholding struc
- Page 135 and 136:
Dividends We consider dividends on
- Page 137 and 138:
ITEM 9. THE OFFER AND LISTING Offer
- Page 139 and 140:
ITEM 10. ADDITIONAL INFORMATION Mem
- Page 141 and 142:
holder of the beneficial interest i
- Page 143 and 144:
Voting Rights Subject to any rights
- Page 145 and 146:
provision of the New Act by any oth
- Page 147 and 148:
South African Companies Act, 2008 A
- Page 149 and 150:
state securities laws. The securiti
- Page 151 and 152:
documents are the agent for the new
- Page 153 and 154:
Dividends There are no restrictions
- Page 155 and 156:
STC STC is imposed on South African
- Page 157 and 158:
with any connected persons) held mo
- Page 159 and 160:
of our ordinary shares or ADSs, as
- Page 161 and 162:
of gain recognized on a sale or oth
- Page 163 and 164:
integrated operations could be adve
- Page 165 and 166:
PART II ITEM 13. DEFAULTS, DIVIDEND
- Page 167 and 168:
(d) Changes in Internal Control ove
- Page 169 and 170:
PART III ITEM 17. FINANCIAL STATEME
- Page 171 and 172:
4.13 Credit Agreement, dated August
- Page 173 and 174:
SIGNATURES The registrant hereby ce
- Page 175 and 176:
REPORT OF THE INDEPENDENT REGISTERE
- Page 177 and 178:
SAPPI GROUP STATEMENT OF COMPREHENS
- Page 179 and 180:
SAPPI GROUP CASH FLOW STATEMENT for
- Page 181 and 182:
SAPPI NOTES TO THE GROUP ANNUAL FIN
- Page 183 and 184:
SAPPI NOTES TO THE GROUP ANNUAL FIN
- Page 185 and 186:
SAPPI NOTES TO THE GROUP ANNUAL FIN
- Page 187 and 188:
SAPPI NOTES TO THE GROUP ANNUAL FIN
- Page 189 and 190:
SAPPI NOTES TO THE GROUP ANNUAL FIN
- Page 191 and 192:
SAPPI NOTES TO THE GROUP ANNUAL FIN
- Page 193 and 194:
SAPPI NOTES TO THE GROUP ANNUAL FIN
- Page 195 and 196:
SAPPI NOTES TO THE GROUP ANNUAL FIN
- Page 197 and 198:
SAPPI NOTES TO THE GROUP ANNUAL FIN
- Page 199 and 200:
SAPPI NOTES TO THE GROUP ANNUAL FIN
- Page 201 and 202:
SAPPI NOTES TO THE GROUP ANNUAL FIN
- Page 203 and 204:
SAPPI NOTES TO THE GROUP ANNUAL FIN
- Page 205 and 206:
SAPPI NOTES TO THE GROUP ANNUAL FIN
- Page 207 and 208:
SAPPI NOTES TO THE GROUP ANNUAL FIN
- Page 209 and 210:
10. PLANTATIONS SAPPI NOTES TO THE
- Page 211 and 212:
SAPPI NOTES TO THE GROUP ANNUAL FIN
- Page 213 and 214:
SAPPI NOTES TO THE GROUP ANNUAL FIN
- Page 215 and 216:
SAPPI NOTES TO THE GROUP ANNUAL FIN
- Page 217 and 218:
SAPPI NOTES TO THE GROUP ANNUAL FIN
- Page 219 and 220:
SAPPI NOTES TO THE GROUP ANNUAL FIN
- Page 221 and 222:
SAPPI NOTES TO THE GROUP ANNUAL FIN
- Page 223 and 224:
SAPPI NOTES TO THE GROUP ANNUAL FIN
- Page 225 and 226:
SAPPI NOTES TO THE GROUP ANNUAL FIN
- Page 227 and 228:
SAPPI NOTES TO THE GROUP ANNUAL FIN
- Page 229 and 230:
SAPPI NOTES TO THE GROUP ANNUAL FIN
- Page 231 and 232:
22. PROVISIONS SAPPI NOTES TO THE G
- Page 233 and 234:
SAPPI NOTES TO THE GROUP ANNUAL FIN
- Page 235 and 236:
SAPPI NOTES TO THE GROUP ANNUAL FIN
- Page 237 and 238:
SAPPI NOTES TO THE GROUP ANNUAL FIN
- Page 239 and 240:
SAPPI NOTES TO THE GROUP ANNUAL FIN
- Page 241 and 242:
SAPPI NOTES TO THE GROUP ANNUAL FIN
- Page 243 and 244:
SAPPI NOTES TO THE GROUP ANNUAL FIN
- Page 245 and 246:
SAPPI NOTES TO THE GROUP ANNUAL FIN
- Page 247 and 248:
SAPPI NOTES TO THE GROUP ANNUAL FIN
- Page 249 and 250:
SAPPI NOTES TO THE GROUP ANNUAL FIN
- Page 251 and 252:
SAPPI NOTES TO THE GROUP ANNUAL FIN
- Page 253 and 254:
SAPPI NOTES TO THE GROUP ANNUAL FIN
- Page 255 and 256:
SAPPI NOTES TO THE GROUP ANNUAL FIN
- Page 257 and 258:
SAPPI NOTES TO THE GROUP ANNUAL FIN
- Page 259 and 260:
SAPPI NOTES TO THE GROUP ANNUAL FIN
- Page 261 and 262:
SAPPI NOTES TO THE GROUP ANNUAL FIN
- Page 263 and 264:
SAPPI NOTES TO THE GROUP ANNUAL FIN
- Page 265 and 266:
SAPPI NOTES TO THE GROUP ANNUAL FIN
- Page 267 and 268:
SAPPI NOTES TO THE GROUP ANNUAL FIN
- Page 269 and 270:
SAPPI NOTES TO THE GROUP ANNUAL FIN
- Page 271 and 272:
SAPPI NOTES TO THE GROUP ANNUAL FIN
- Page 273 and 274:
SAPPI NOTES TO THE GROUP ANNUAL FIN
- Page 275 and 276:
SAPPI NOTES TO THE GROUP ANNUAL FIN
- Page 277 and 278:
SAPPI NOTES TO THE GROUP ANNUAL FIN
- Page 279 and 280:
SAPPI NOTES TO THE GROUP ANNUAL FIN
- Page 281 and 282:
SAPPI NOTES TO THE GROUP ANNUAL FIN
- Page 283 and 284:
SAPPI NOTES TO THE GROUP ANNUAL FIN
- Page 285 and 286:
SAPPI NOTES TO THE GROUP ANNUAL FIN
- Page 287 and 288:
SAPPI NOTES TO THE GROUP ANNUAL FIN
- Page 289 and 290:
SAPPI NOTES TO THE GROUP ANNUAL FIN
- Page 291 and 292:
SAPPI NOTES TO THE GROUP ANNUAL FIN
- Page 293 and 294:
SAPPI CONDENSED SAPPI LIMITED COMPA
- Page 295 and 296:
SAPPI CONDENSED SAPPI LIMITED COMPA
- Page 297 and 298:
SAPPI CONDENSED SAPPI LIMITED COMPA
- Page 299:
SAPPI NOTES TO THE CONDENSED SAPPI