
Create successful ePaper yourself
Turn your PDF publications into a flip-book with our unique Google optimized e-Paper software.
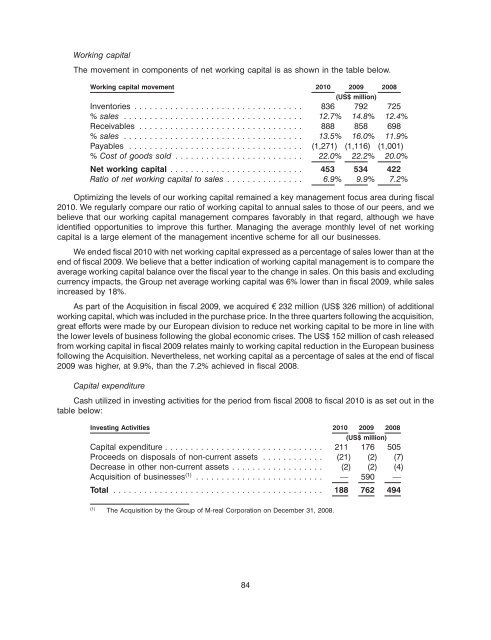
Working capital<br />
The movement in components of net working capital is as shown in the table below.<br />
Working capital movement 2010 2009<br />
(US$ million)<br />
2008<br />
Inventories ................................. 836 792 725<br />
% sales ................................... 12.7% 14.8% 12.4%<br />
Receivables ................................ 888 858 698<br />
% sales ................................... 13.5% 16.0% 11.9%<br />
Payables .................................. (1,271) (1,116) (1,001)<br />
% Cost of goods sold ......................... 22.0% 22.2% 20.0%<br />
Net working capital .......................... 453 534 422<br />
Ratio of net working capital to sales ............... 6.9% 9.9% 7.2%<br />
Optimizing the levels of our working capital remained a key management focus area during fiscal<br />
2010. We regularly compare our ratio of working capital to annual sales to those of our peers, and we<br />
believe that our working capital management compares favorably in that regard, although we have<br />
identified opportunities to improve this further. Managing the average monthly level of net working<br />
capital is a large element of the management incentive scheme for all our businesses.<br />
We ended fiscal 2010 with net working capital expressed as a percentage of sales lower than at the<br />
end of fiscal 2009. We believe that a better indication of working capital management is to compare the<br />
average working capital balance over the fiscal year to the change in sales. On this basis and excluding<br />
currency impacts, the Group net average working capital was 6% lower than in fiscal 2009, while sales<br />
increased by 18%.<br />
As part of the Acquisition in fiscal 2009, we acquired e 232 million (US$ 326 million) of additional<br />
working capital, which was included in the purchase price. In the three quarters following the acquisition,<br />
great efforts were made by our European division to reduce net working capital to be more in line with<br />
the lower levels of business following the global economic crises. The US$ 152 million of cash released<br />
from working capital in fiscal 2009 relates mainly to working capital reduction in the European business<br />
following the Acquisition. Nevertheless, net working capital as a percentage of sales at the end of fiscal<br />
2009 was higher, at 9.9%, than the 7.2% achieved in fiscal 2008.<br />
Capital expenditure<br />
Cash utilized in investing activities for the period from fiscal 2008 to fiscal 2010 is as set out in the<br />
table below:<br />
Investing Activities 2010 2009 2008<br />
(US$ million)<br />
Capital expenditure ............................... 211 176 505<br />
Proceeds on disposals of non-current assets ............ (21) (2) (7)<br />
Decrease in other non-current assets .................. (2) (2) (4)<br />
Acquisition of businesses (1) ......................... — 590 —<br />
Total ......................................... 188 762 494<br />
(1) The Acquisition by the Group of M-real Corporation on December 31, 2008.<br />
84