

MS AR 2018 (1)

Create successful ePaper yourself
Turn your PDF publications into a flip-book with our unique Google optimized e-Paper software.
NOTES TO AND FORMING P<strong>AR</strong>T OF THE<br />
FINANCIAL STATEMENTS<br />
FOR THE YE<strong>AR</strong> ENDED JUNE 30, <strong>2018</strong><br />
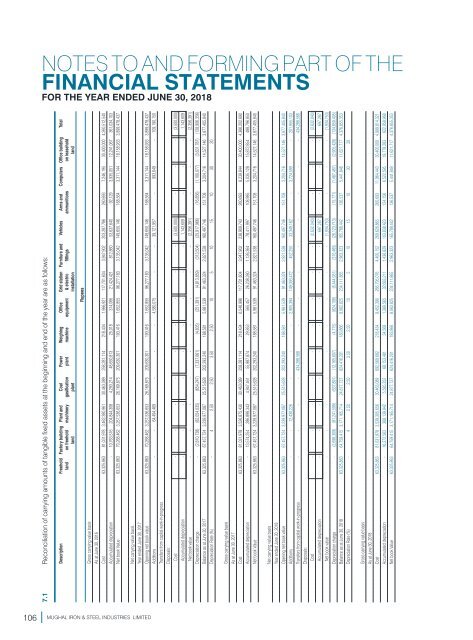
7.1 Reconciliation of carrying amounts of tangible fixed assets at the beginning and end of the year are as follows:<br />
Description Freehold Factory building Plant and Coal Power Weighing Office Grid station Furniture and Vehicles Arms and Computers Office building Total<br />
land on freehold machinery gasification plant machine equipment & electric fittings ammunitions on leasehold<br />
land plant installation land<br />
Gross carrying value basis<br />
As at June 30, 2016<br />
Cost 63,325,863 81,031,978 3,462,380,961 30,463,089 258,281,114 218,434 1,966,921 117,701,604 3,947,902 203,287,786 260,693 7,246,195 30,400,000 4,260,512,540<br />
Accumulated depreciation - 10,763,516 204,844,308 4,293,214 48,650,813 25,018 314,066 21,424,421 812,860 53,637,640 92,129 3,935,051 12,241,067 361,034,103<br />
Net book Value 63,325,863 70,268,462 3,257,536,653 26,169,875 209,630,301 193,416 1,652,855 96,277,183 3,135,042 149,650,146 168,564 3,311,144 18,158,933 3,899,478,437<br />
Rupees<br />
Net carrying value basis<br />
Year ended June 30, 2017<br />
Opening net book value 63,325,863 70,268,462 3,257,536,653 26,169,875 209,630,301 193,416 1,652,855 96,277,183 3,135,042 149,650,146 168,564 3,311,144 18,158,933 3,899,478,437<br />
Additions - - 64,494,469 - - - 4,580,075 - - 39,121,957 - 993,649 - 109,190,150<br />
Transfers from capital work-in-progress<br />
Disposals:<br />
Cost - - - - - - - - - (3,500,000) - - - (3,500,000)<br />
Accumulated depreciation - - - - - - - - - 1,143,609 - - - 1,143,609<br />
Net book value - - - - - - - - - (2,356,391) - - - (2,356,391)<br />
Depreciation charge - (2,810,738) (82,054,035) (654,247) (7,337,061) (4,835) (251,391) (4,813,859) (313,504) (25,917,966) (16,856) (1,100,077) (3,631,787) (128,906,356)<br />
Balance as at June 30, 2017 63,325,863 67,457,724 3,239,977,087 25,515,628 202,293,240 188,581 5,981,539 91,463,324 2,821,538 160,497,746 151,708 3,204,716 14,527,146 3,877,405,840<br />
Depreciation Rate (%) - 4 2.50 2.50 3.50 2.50 10 5 10 15 10 30 20<br />
Gross carrying value basis<br />
As at June 30, 2017<br />
Cost 63,325,863 81,031,978 3,526,875,430 30,463,089 258,281,114 218,434 6,546,996 117,701,604 3,947,902 238,909,743 260,693 8,239,844 30,400,000 4,366,202,690<br />
Accumulated depreciation - 13,574,254 286,898,343 4,947,461 55,987,874 29,853 565,457 26,238,280 1,126,364 78,411,997 108,985 5,035,128 15,872,854 488,796,850<br />
Net book Value 63,325,863 67,457,724 3,239,977,087 25,515,628 202,293,240 188,581 5,981,539 91,463,324 2,821,538 160,497,746 151,708 3,204,716 14,527,146 3,877,405,840<br />
Net carrying value basis<br />
Year ended June 30, <strong>2018</strong><br />
Opening net book value 63,325,863 67,457,724 3,239,977,087 25,515,628 202,293,240 188,581 5,981,539 91,463,324 2,821,538 160,497,746 151,708 3,204,716 14,527,146 3,877,405,840<br />
Additions - - 12,430,226 - - - 2,905,394 149,093,472 452,250 33,349,162 - 3,724,599 - 201,955,103<br />
Transfers from capital work-in-progress - - - - 434,288,568 - - - - - - - - 434,288,568<br />
Disposals:<br />
Cost - - - - - - - - - (2,632,040) - - - (2,632,040)<br />
Accumulated depreciation - - - - - - - - - 697,287 - - - 697,287<br />
Net book value - - - - - - - - - (1,934,753) - - - (1,934,753)<br />
Depreciation charge - (2,698,309) (81,241,599) (637,891) (12,165,607) (4,715) (824,108) (6,444,931) (310,465) (26,123,713) (15,171) (1,487,467) (2,905,429) (134,859,405)<br />
Balance as at June 30, <strong>2018</strong> 63,325,863 64,759,415 3,171,165,714 24,877,737 624,416,201 183,866 8,062,825 234,111,865 2,963,323 165,788,442 136,537 5,441,848 11,621,717 4,376,855,353<br />
Depreciation Rate (%) - 4 2.50 2.50 3.50 2.50 10 5 10 15 10 30 20<br />
Gross carrying value basis<br />
As at June 30, <strong>2018</strong><br />
Cost 63,325,863 81,031,978 3,539,305,656 30,463,089 692,569,682 218,434 9,452,390 266,795,076 4,400,152 269,626,865 260,693 11,964,443 30,400,000 4,999,814,321<br />
Accumulated depreciation - 16,272,563 368,139,942 5,585,352 68,153,481 34,568 1,389,565 32,683,211 1,436,829 103,838,423 124,156 6,522,595 18,778,283 622,958,968<br />
Net book Value 63,325,863 64,759,415 3,171,165,714 24,877,737 624,416,201 183,866 8,062,825 234,111,865 2,963,323 165,788,442 136,537 5,441,848 11,621,717 4,376,855,353<br />
106 MUGHAL IRON & STEEL INDUSTRIES LIMITED