

MS AR 2018 (1)

Create successful ePaper yourself
Turn your PDF publications into a flip-book with our unique Google optimized e-Paper software.
ANALYSIS OF<br />
FINANCIAL RATIOS<br />
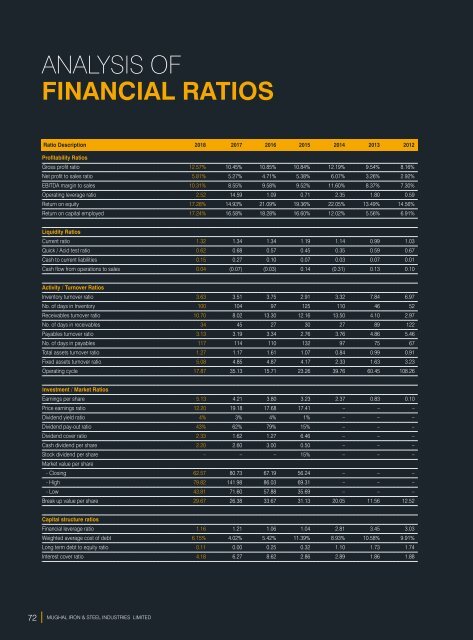
Ratio Description <strong>2018</strong> 2017 2016 2015 2014 2013 2012<br />
Profitability Ratios<br />
Gross profit ratio 12.57% 10.45% 10.85% 10.84% 12.19% 9.54% 8.16%<br />
Net profit to sales ratio 5.81% 5.27% 4.71% 5.38% 6.07% 3.26% 2.92%<br />
EBITDA margin to sales 10.31% 8.55% 9.58% 9.52% 11.60% 8.37% 7.30%<br />
Operating leverage ratio 2.52 14.59 1.09 0.71 2.35 1.80 0.59<br />
Return on equity 17.28% 14.93% 21.09% 19.36% 22.05% 13.49% 14.56%<br />
Return on capital employed 17.24% 16.58% 18.28% 16.60% 12.02% 5.56% 6.91%<br />
Liquidity Ratios<br />
Current ratio 1.32 1.34 1.34 1.19 1.14 0.99 1.03<br />
Quick / Acid test ratio 0.62 0.68 0.57 0.45 0.35 0.59 0.67<br />
Cash to current liabilities 0.15 0.27 0.10 0.07 0.03 0.07 0.01<br />
Cash flow from operations to sales 0.04 (0.07) (0.03) 0.14 (0.31) 0.13 0.10<br />
Activity / Turnover Ratios<br />
Inventory turnover ratio 3.63 3.51 3.75 2.91 3.32 7.84 6.97<br />
No. of days in Inventory 100 104 97 125 110 46 52<br />
Receivables turnover ratio 10.70 8.02 13.30 12.16 13.50 4.10 2.97<br />
No. of days in receivables 34 45 27 30 27 89 122<br />
Payables turnover ratio 3.13 3.19 3.34 2.76 3.76 4.86 5.46<br />
No. of days in payables 117 114 110 132 97 75 67<br />
Total assets turnover ratio 1.27 1.17 1.61 1.07 0.84 0.99 0.91<br />
Fixed assets turnover ratio 5.08 4.85 4.87 4.17 2.33 1.63 3.23<br />
Operating cycle 17.87 35.13 15.71 23.26 39.76 60.45 108.26<br />
Investment / Market Ratios<br />
Earnings per share 5.13 4.21 3.80 3.23 2.37 0.83 0.10<br />
Price earnings ratio 12.20 19.18 17.68 17.41 – – –<br />
Dividend yield ratio 4% 3% 4% 1% – – –<br />
Dividend pay-out ratio 43% 62% 79% 15% – – –<br />
Dividend cover ratio 2.33 1.62 1.27 6.46 – – –<br />
Cash dividend per share 2.20 2.60 3.00 0.50 – – –<br />
Stock dividend per share – – – 15% – – –<br />
Market value per share<br />
- Closing 62.57 80.73 67.19 56.24 – – –<br />
- High 79.82 141.98 86.03 69.31 – – –<br />
- Low 43.81 71.60 57.88 35.69 – – –<br />
Break up value per share 29.67 26.38 33.67 31.13 20.05 11.56 12.52<br />
Capital structure ratios<br />
Financial leverage ratio 1.16 1.21 1.06 1.04 2.81 3.45 3.03<br />
Weighted average cost of debt 6.15% 4.02% 5.42% 11.39% 8.93% 10.58% 9.91%<br />
Long term debt to equity ratio 0.11 0.00 0.25 0.32 1.10 1.73 1.74<br />
Interest cover ratio 4.18 6.27 8.62 2.86 2.89 1.86 1.88<br />
72 MUGHAL IRON & STEEL INDUSTRIES LIMITED