

MS AR 2018 (1)

Create successful ePaper yourself
Turn your PDF publications into a flip-book with our unique Google optimized e-Paper software.
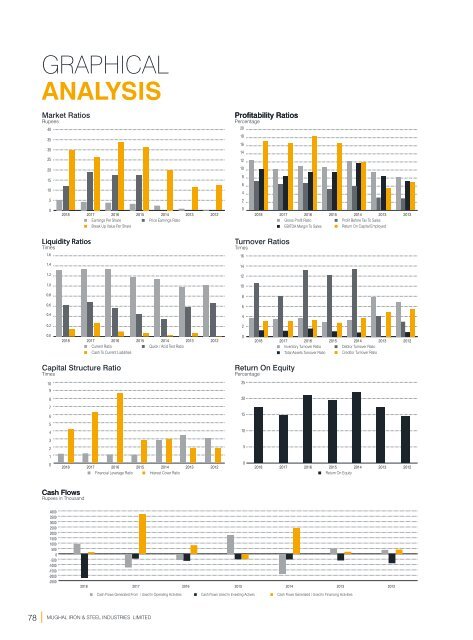
GRAPHICAL<br />
ANALYSIS<br />
Market Ratios<br />
Rupees<br />
40<br />
35<br />
30<br />
25<br />
20<br />
15<br />
10<br />
5<br />
0<br />
1.6<br />
1.4<br />
1.2<br />
1.0<br />
0.8<br />
0.6<br />
0.4<br />
0.2<br />
<strong>2018</strong> 2017 2016 2015 2014 2013 2012<br />
Earnings Per Share<br />
Price Earnings Ratio<br />
Break Up Value Per Share<br />
Liquidity Ratios<br />
Times<br />
Profitability Ratios<br />
Percentage<br />
20<br />
18<br />
16<br />
14<br />
12<br />
10<br />
8<br />
6<br />
4<br />
2<br />
0<br />
<strong>2018</strong> 2017 2016 2015 2014 2013 2012<br />
Gross Profit Ratio<br />
EBITDA Margin To Sales<br />
Profit Before Tax To Sales<br />
Return On Capital Employed<br />
Turnover Ratios<br />
Times<br />
16<br />
14<br />
12<br />
10<br />
8<br />
6<br />
4<br />
2<br />
0.0<br />
<strong>2018</strong> 2017 2016 2015 2014 2013 2012<br />
Current Ratio<br />
Quick / Acid Test Ratio<br />
Cash To Current Liabilities<br />
0<br />
<strong>2018</strong> 2017 2016 2015 2014 2013 2012<br />
Inventory Turnover Ratio<br />
Total Assets Turnover Ratio<br />
Debtor Turnover Ratio<br />
Creditor Turnover Ratio<br />
Capital Structure Ratio<br />
Times<br />
10<br />
9<br />
8<br />
7<br />
6<br />
5<br />
4<br />
3<br />
2<br />
1<br />
0<br />
<strong>2018</strong> 2017 2016 2015 2014 2013 2012<br />
Financial Leverage Ratio Interest Cover Ratio<br />
Return On Equity<br />
Percentage<br />
25<br />
20<br />
15<br />
10<br />
5<br />
0<br />
<strong>2018</strong> 2017 2016 2015 2014 2013 2012<br />
Return On Equity<br />
Cash Flows<br />
Rupees in Thousand<br />
4000<br />
3500<br />
3000<br />
2500<br />
2000<br />
1500<br />
1000<br />
500<br />
0<br />
-500<br />
-1000<br />
-1500<br />
-2000<br />
-2500<br />
<strong>2018</strong><br />
2017 2016 2015 2014 2013 2012<br />
Cash Flows Generated From / Used In Operating Activities Cash Flows Used In Investing Actives Cash Flows Generated / Used In Financing Activities<br />
78 MUGHAL IRON & STEEL INDUSTRIES LIMITED