

MS AR 2018 (1)

Create successful ePaper yourself
Turn your PDF publications into a flip-book with our unique Google optimized e-Paper software.
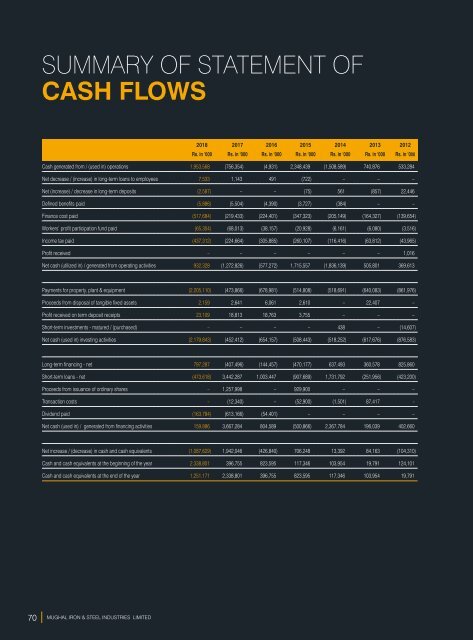
SUMM<strong>AR</strong>Y OF STATEMENT OF<br />
CASH FLOWS<br />
<strong>2018</strong> 2017 2016 2015 2014 2013 2012<br />
Rs. in ‘000 Rs. in ‘000 Rs. in ‘000 Rs. in ‘000 Rs. in ‘000 Rs. in ‘000 Rs. in ‘000<br />
Cash generated from / (used in) operations 1,953,568 (756,354) (4,931) 2,348,439 (1,508,589) 740,876 533,284<br />
Net decrease / (increase) in long-term loans to employees 7,533 1,143 491 (722) – – –<br />
Net (increase) / decrease in long-term deposits (2,587) – – (75) 561 (857) 22,446<br />
Defined benefits paid (5,886) (5,504) (4,390) (3,727) (384) – –<br />
Finance cost paid (517,684) (219,433) (224,401) (347,323) (205,149) (164,327) (139,654)<br />
Workers’ profit participation fund paid (65,304) (68,013) (38,157) (20,928) (6,161) (6,080) (3,516)<br />
Income tax paid (437,312) (224,664) (305,885) (260,107) (116,416) (63,812) (43,965)<br />
Profit received – – – – – – 1,016<br />
Net cash (utilized in) / generated from operating activities 932,328 (1,272,826) (577,272) 1,715,557 (1,836,139) 505,801 369,613<br />
Payments for property, plant & equipment (2,205,110) (473,866) (678,981) (514,808) (518,691) (640,083) (861,976)<br />
Proceeds from disposal of tangible fixed assets 2,159 2,641 6,061 2,610 – 22,407 –<br />
Profit received on term deposit receipts 23,109 18,813 18,763 3,755 – – –<br />
Short-term investments - matured / (purchased) – – – – 438 – (14,607)<br />
Net cash (used in) investing activities (2,179,843) (452,412) (654,157) (508,443) (518,252) (617,676) (876,583)<br />
Long-term financing - net 797,287 (407,496) (144,457) (470,177) 637,493 360,578 825,860<br />
Short-term loans - net (473,618) 3,442,287 1,003,447 (907,689) 1,731,792 (251,956) (423,200)<br />
Proceeds from issuance of ordinary shares – 1,257,998 – 929,900 – – –<br />
Transaction costs – (12,340) – (52,900) (1,501) 87,417 -<br />
Dividend paid (163,784) (613,166) (54,401) – – – –<br />
Net cash (used in) / generated from financing activities 159,886 3,667,284 804,589 (500,866) 2,367,784 196,039 402,660<br />
Net increase / (decrease) in cash and cash equivalents (1,087,629) 1,942,046 (426,840) 706,248 13,392 84,163 (104,310)<br />
Cash and cash equivalents at the beginning of the year 2,338,801 396,755 823,595 117,346 103,954 19,791 124,101<br />
Cash and cash equivalents at the end of the year 1,251,171 2,338,801 396,755 823,595 117,346 103,954 19,791<br />
70 MUGHAL IRON & STEEL INDUSTRIES LIMITED