

MS AR 2018 (1)

You also want an ePaper? Increase the reach of your titles
YUMPU automatically turns print PDFs into web optimized ePapers that Google loves.
DUPONT<br />
ANALYSIS<br />
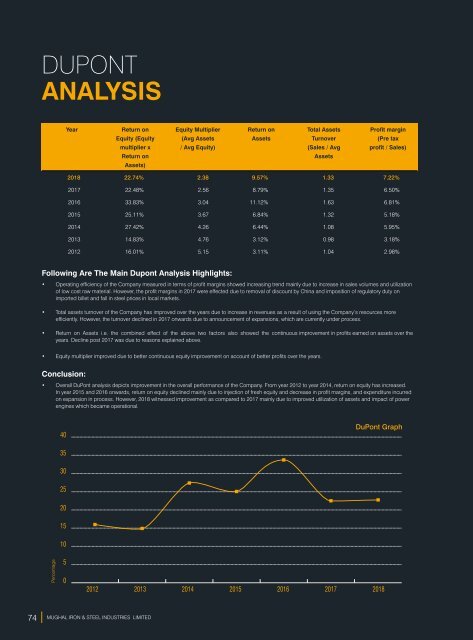
Year Return on Equity Multiplier Return on Total Assets Profit margin<br />
Equity (Equity (Avg Assets Assets Turnover (Pre tax<br />
multiplier x / Avg Equity) (Sales / Avg profit / Sales)<br />
Return on<br />
Assets<br />
Assets)<br />
<strong>2018</strong> 22.74% 2.38 9.57% 1.33 7.22%<br />
2017 22.48% 2.56 8.79% 1.35 6.50%<br />
2016 33.83% 3.04 11.12% 1.63 6.81%<br />
2015 25.11% 3.67 6.84% 1.32 5.18%<br />
2014 27.42% 4.26 6.44% 1.08 5.95%<br />
2013 14.83% 4.76 3.12% 0.98 3.18%<br />
2012 16.01% 5.15 3.11% 1.04 2.98%<br />
Following Are The Main Dupont Analysis Highlights:<br />
• Operating efficiency of the Company measured in terms of profit margins showed increasing trend mainly due to increase in sales volumes and utilization<br />
of low cost raw material. However, the profit margins in 2017 were effected due to removal of discount by China and imposition of regulatory duty on<br />
imported billet and fall in steel prices in local markets.<br />
• Total assets turnover of the Company has improved over the years due to increase in revenues as a result of using the Company’s resources more<br />
efficiently. However, the turnover declined in 2017 onwards due to announcement of expansions, which are currently under process.<br />
• Return on Assets i.e. the combined effect of the above two factors also showed the continuous improvement in profits earned on assets over the<br />
years. Decline post 2017 was due to reasons explained above.<br />
• Equity multiplier improved due to better continuous equity improvement on account of better profits over the years.<br />
Conclusion:<br />
• Overall DuPont analysis depicts improvement in the overall performance of the Company. From year 2012 to year 2014, return on equity has increased.<br />
In year 2015 and 2016 onwards, return on equity declined mainly due to injection of fresh equity and decrease in profit margins, and expenditure incurred<br />
on expansion in process. However, <strong>2018</strong> witnessed improvement as compared to 2017 mainly due to improved utilization of assets and impact of power<br />
engines which became operational.<br />
40<br />
DuPont Graph<br />
35<br />
30<br />
25<br />
20<br />
15<br />
Percentage<br />
10<br />
5<br />
0<br />
2012 2013 2014 2015 2016 2017 <strong>2018</strong><br />
74 MUGHAL IRON & STEEL INDUSTRIES LIMITED