

MS AR 2018 (1)

You also want an ePaper? Increase the reach of your titles
YUMPU automatically turns print PDFs into web optimized ePapers that Google loves.
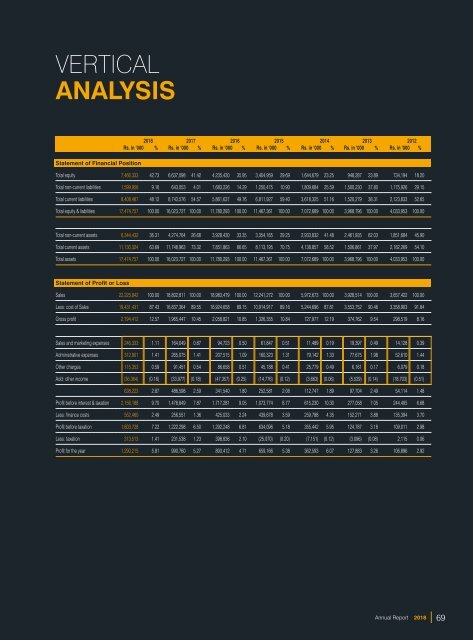
VERTICAL<br />
ANALYSIS<br />
Statement of Financial Position<br />
<strong>2018</strong> 2017 2016 2015 2014 2013 2012<br />
Rs. in ‘000 % Rs. in ‘000 % Rs. in ‘000 % Rs. in ‘000 % Rs. in ‘000 % Rs. in ‘000 % Rs. in ‘000 %<br />
Total equity 7,466,333 42.73 6,637,098 41.42 4,235,430 35.95 3,404,959 29.69 1,644,679 23.25 948,287 23.89 734,194 18.20<br />
Total non-current liabilities 1,599,956 9.16 643,053 4.01 1,683,226 14.29 1,250,475 10.90 1,809,684 25.59 1,500,230 37.80 1,175,926 29.15<br />
Total current liabilities 8,408,467 48.12 8,743,576 54.57 5,861,637 49.76 6,811,927 59.40 3,618,325 51.16 1,520,279 38.31 2,123,833 52.65<br />
Total equity & liabilities 17,474,757 100.00 16,023,727 100.00 11,780,293 100.00 11,467,361 100.00 7,072,689 100.00 3,968,796 100.00 4,033,953 100.00<br />
Total non-current assets 6,344,432 36.31 4,274,764 26.68 3,928,430 33.35 3,354,165 29.25 2,933,832 41.48 2,461,935 62.03 1,851,684 45.90<br />
Total current assets 11,130,324 63.69 11,748,963 73.32 7,851,863 66.65 8,113,195 70.75 4,138,857 58.52 1,506,861 37.97 2,182,269 54.10<br />
Total assets 17,474,757 100.00 16,023,727 100.00 11,780,293 100.00 11,467,361 100.00 7,072,689 100.00 3,968,796 100.00 4,033,953 100.00<br />
Statement of Profit or Loss<br />
Sales 22,225,842 100.00 18,802,811 100.00 18,983,479 100.00 12,241,272 100.00 5,972,673 100.00 3,928,514 100.00 3,657,422 100.00<br />
Less: cost of Sales 19,431,431 87.43 16,837,364 89.55 16,924,658 89.15 10,914,917 89.16 5,244,696 87.81 3,553,752 90.46 3,358,903 91.84<br />
Gross profit 2,794,412 12.57 1,965,447 10.45 2,058,821 10.85 1,326,355 10.84 727,977 12.19 374,762 9.54 298,519 8.16<br />
Sales and marketing expenses 246,333 1.11 164,049 0.87 94,723 0.50 61,847 0.51 11,489 0.19 19,397 0.49 14,128 0.39<br />
Administrative expenses 312,901 1.41 265,075 1.41 207,515 1.09 160,323 1.31 79,142 1.33 77,675 1.98 52,610 1.44<br />
Other charges 115,353 0.59 91,451 0.54 86,658 0.51 45,188 0.41 25,779 0.49 6,161 0.17 6,079 0.18<br />
Add: other income (36,364) (0.16) (33,977) (0.18) (47,357) (0.25) (14,776) (0.12) (3,663) (0.06) (5,529) (0.14) (18,703) (0.51)<br />
638,223 2.87 486,598 2.59 341,540 1.80 252,581 2.06 112,747 1.89 97,704 2.49 54,114 1.48<br />
Profit before interest & taxation 2,156,188 9.70 1,478,849 7.87 1,717,281 9.05 1,073,774 8.77 615,230 10.30 277,058 7.05 244,405 6.68<br />
Less: finance costs 552,460 2.49 256,551 1.36 425,033 2.24 439,678 3.59 259,788 4.35 152,271 3.88 135,394 3.70<br />
Profit before taxation 1,603,728 7.22 1,222,298 6.50 1,292,248 6.81 634,096 5.18 355,442 5.95 124,787 3.18 109,011 2.98<br />
Less: taxation 313,513 1.41 231,538 1.23 398,836 2.10 (25,070) (0.20) (7,151) (0.12) (3,096) (0.08) 2,115 0.06<br />
Profit for the year 1,290,215 5.81 990,760 5.27 893,412 4.71 659,166 5.38 362,593 6.07 127,883 3.26 106,896 2.92<br />
Annual Report <strong>2018</strong><br />
69