

MS AR 2018 (1)

You also want an ePaper? Increase the reach of your titles
YUMPU automatically turns print PDFs into web optimized ePapers that Google loves.
KEY OPERATING AND<br />
FINANCIAL DATA<br />
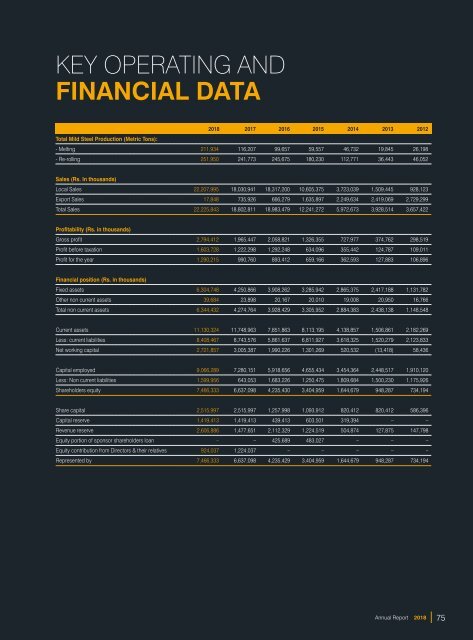
<strong>2018</strong> 2017 2016 2015 2014 2013 2012<br />
Total Mild Steel Production (Metric Tons):<br />
- Melting 211,934 116,207 99,657 59,557 46,732 19,845 26,198<br />
- Re-rolling 251,950 241,773 245,675 180,230 112,771 36,443 46,052<br />
Sales (Rs. In thousands)<br />
Local Sales 22,207,995 18,030,941 18,317,200 10,605,375 3,723,039 1,509,445 928,123<br />
Export Sales 17,848 735,926 666,279 1,635,897 2,249,634 2,419,069 2,729,299<br />
Total Sales 22,225,843 18,802,811 18,983,479 12,241,272 5,972,673 3,928,514 3,657,422<br />
Profitability (Rs. in thousands)<br />
Gross profit 2,794,412 1,965,447 2,058,821 1,326,355 727,977 374,762 298,519<br />
Profit before taxation 1,603,728 1,222,298 1,292,248 634,096 355,442 124,787 109,011<br />
Profit for the year 1,290,215 990,760 893,412 659,166 362,593 127,883 106,896<br />
Financial position (Rs. in thousands)<br />
Fixed assets 6,304,748 4,250,866 3,908,262 3,285,942 2,865,375 2,417,188 1,131,782<br />
Other non current assets 39,684 23,898 20,167 20,010 19,008 20,950 16,766<br />
Total non current assets 6,344,432 4,274,764 3,928,429 3,305,952 2,884,383 2,438,138 1,148,548<br />
Current assets 11,130,324 11,748,963 7,851,863 8,113,195 4,138,857 1,506,861 2,182,269<br />
Less: current liabilities 8,408,467 8,743,576 5,861,637 6,811,927 3,618,325 1,520,279 2,123,833<br />
Net working capital 2,721,857 3,005,387 1,990,226 1,301,269 520,532 (13,418) 58,436<br />
Capital employed 9,066,289 7,280,151 5,918,656 4,655,434 3,454,364 2,448,517 1,910,120<br />
Less: Non current liabilities 1,599,956 643,053 1,683,226 1,250,475 1,809,684 1,500,230 1,175,926<br />
Shareholders equity 7,466,333 6,637,098 4,235,430 3,404,959 1,644,679 948,287 734,194<br />
Share capital 2,515,997 2,515,997 1,257,998 1,093,912 820,412 820,412 586,396<br />
Capital reserve 1,419,413 1,419,413 439,413 603,501 319,394 – –<br />
Revenue reserve 2,606,886 1,477,651 2,112,329 1,224,519 504,874 127,875 147,798<br />
Equity portion of sponsor shareholders loan – – 425,689 483,027 – – –<br />
Equity contribution from Directors & their relatives 924,037 1,224,037 – – – – –<br />
Represented by 7,466,333 6,637,098 4,235,429 3,404,959 1,644,679 948,287 734,194<br />
Annual Report <strong>2018</strong><br />
75