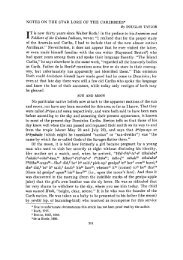
Table 14.2b. Cont<strong>in</strong>ued CEI CUD ECD CVR OST JDL LCL SAL VIR ANS VEN 50,0 30,8 59,6 14,3 70,5 31,1 41,3 42,9 40,0 73,9 52,4 50 13 52 14 44 45 46 21 20 23 21 25,8 57,1 35,3 55,0 55,6 48,6 54,5 10,0 71,4 31,2 42,3 62 7 51 20 36 37 55 10 7 16 26 14,5 0,0 43,1 33,3 32,8 47,4 31,2 30,8 64,3 31,8 27,3 62 6 51 9 61 76 93 13 14 22 33 77,3 88,9 47,1 78,6 67,6 52,3 62,2 100,0 77,8 50,0 40,0 44 9 34 14 37 65 74 4 9 6 10 87,5 100,0 69,8 77,8 83,6 67,5 67,0 71,4 46,7 76,9 71,0 72 12 43 18 55 77 91 7 15 13 31 54,4 64,3 14,0 35,7 15,7 24,4 35,7 50,0 21,4 11,1 37,9 68 14 43 14 51 82 84 8 14 9 29 33,3 63,6 60,0 17,6 54,2 70,1 54,8 36,4 66,7 45,5 34,5 42 11 45 17 48 77 84 11 15 11 29 11,8 11,1 47,4 6,2 34,1 17,1 21,9 33,3 25,0 14,3 51,6 51 9 38 16 44 70 73 6 12 7 31 12,9 0,0 28,2 0,0 0,0 0,0 4,9 14,3 0,0 30,0 16,0 31 8 39 16 43 75 82 7 12 10 25 69,1 66,7 31,7 78,9 26,3 16,7 48,9 16,7 62,5 22,2 48,5 68 12 41 19 57 78 92 6 16 9 33 98,3 100,0 75,0 86,7 40,7 39,6 71,1 100,0 83,3 100,0 92,9 58 8 16 15 27 53 45 10 6 8 14 94,6 100,0 97,6 94,1 96,2 95,1 100,0 100,0 100,0 100,0 100,0 74 13 42 17 52 81 85 8 13 9 31 20,0 20,0 4,7 23,5 9,1 4,0 10,8 0,0 8,3 30,0 13,6 35 10 43 17 44 75 74 9 12 10 22 2,6 0,0 15,9 5,6 21,0 11,5 27,6 27,3 20,0 7,7 11,9 76 14 44 18 62 87 98 11 15 13 42 10,0 11,1 3,6 5,3 11,7 7,5 6,8 0,0 10,5 13,3 0,0 10 9 28 19 60 67 74 14 19 15 34 37,5 50,0 23,1 17,4 22,6 26,7 15,0 37,5 20,0 50,0 59,1 16 8 26 23 53 60 60 8 20 14 22 36,8 42,9 30,8 11,8 33,3 19,0 26,3 55,6 25,0 20,0 58,3 19 7 13 17 24 42 38 9 8 10 12 You are read<strong>in</strong>g copyrighted material published by <strong>the</strong> University <strong>of</strong> Alabama Press. Any post<strong>in</strong>g, copy<strong>in</strong>g, or distribut<strong>in</strong>g <strong>of</strong> this work beyond fair use as def<strong>in</strong>ed under U.S. Copyright law is illegal <strong>and</strong> <strong>in</strong>jures <strong>the</strong> author <strong>and</strong> publisher. For permission to reuse this work, contact <strong>the</strong> University <strong>of</strong> Alabama Press.
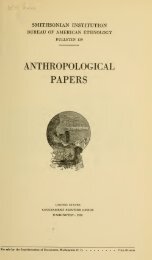
206 / Coppa et al. Figure 14.2. Maximum Likelihood tree. Maximum Likelihood Method (ML) The ML data elaboration highlights <strong>the</strong> presence <strong>of</strong> two ma<strong>in</strong> groups (Figure 14.2). In <strong>the</strong> upper part <strong>of</strong> <strong>the</strong> tree, we can observe all <strong>the</strong> Taíno. This cluster is tied to two branches sport<strong>in</strong>g <strong>the</strong> Saladoid <strong>and</strong> Troumassoid samples, though both nodes are represented less than 50 percent <strong>of</strong> <strong>the</strong> time <strong>in</strong> <strong>the</strong> bootstrap. In <strong>the</strong> lower part <strong>of</strong> <strong>the</strong> tree, <strong>the</strong> Ciboney <strong>from</strong> Cuba <strong>and</strong> Cueva Roja cluster toge<strong>the</strong>r with a node that appears <strong>in</strong> 76 percent <strong>of</strong> <strong>the</strong> iterations. The Florida samples are distributed <strong>in</strong> between <strong>the</strong> two ma<strong>in</strong> groups without form<strong>in</strong>g a clearly def<strong>in</strong>ed group by <strong>the</strong>mselves. A significant bootstrap node (65 percent) connects Fort Center <strong>and</strong> Republic Grooves <strong>from</strong> Florida. Interest<strong>in</strong>gly, <strong>the</strong> Venezuela group is <strong>in</strong> between <strong>the</strong> Florida ones. Pr<strong>in</strong>cipal Component Analysis (PCA) Figure 14.3 shows <strong>the</strong> PCA scatter plot, with <strong>the</strong> first two components expla<strong>in</strong><strong>in</strong>g <strong>the</strong> 40.33 percent <strong>of</strong> all <strong>the</strong> variance (Table 14.3). The scatter plot clearly shows two dist<strong>in</strong>ct clusters. The first one, on <strong>the</strong> left part <strong>of</strong> <strong>the</strong> plot, ga<strong>the</strong>rs toge<strong>the</strong>r <strong>the</strong> Taíno groups along with <strong>the</strong> Saladoid <strong>and</strong> Troumassoid samples. The second cluster, on <strong>the</strong> right side, l<strong>in</strong>ks up all <strong>the</strong> Ciboney groups, both <strong>the</strong> recent ones You are read<strong>in</strong>g copyrighted material published by <strong>the</strong> University <strong>of</strong> Alabama Press. Any post<strong>in</strong>g, copy<strong>in</strong>g, or distribut<strong>in</strong>g <strong>of</strong> this work beyond fair use as def<strong>in</strong>ed under U.S. Copyright law is illegal <strong>and</strong> <strong>in</strong>jures <strong>the</strong> author <strong>and</strong> publisher. For permission to reuse this work, contact <strong>the</strong> University <strong>of</strong> Alabama Press.
- Page 2 and 3:
Crossing the Borders You are readin
- Page 4 and 5:
Crossing the Borders New Methods an
- Page 6 and 7:
Contents List of Illustrations 1. C
- Page 8 and 9:
Contents / vii References Cited 233
- Page 10 and 11:
List of Illustrations FIGURES 2.1.
- Page 12 and 13:
Illustrations / xi 10.2. Use- wear
- Page 14 and 15:
Crossing the Borders You are readin
- Page 16 and 17:
1 Crossing Disciplinary Boundaries
- Page 18 and 19:
New Methods and Techniques / 3 Rous
- Page 20 and 21:
New Methods and Techniques / 5 cal
- Page 22 and 23:
New Methods and Techniques / 7 niqu
- Page 24 and 25:
New Methods and Techniques / 9 (Van
- Page 26 and 27:
New Methods and Techniques / 11 tur
- Page 28 and 29:
New Methods and Techniques / 13 inc
- Page 30 and 31:
New Methods and Techniques / 15 ect
- Page 32 and 33:
New Methods and Techniques / 17 Pal
- Page 34 and 35:
I PROVENANCE STUDIES You are readin
- Page 36 and 37:
2 In Tuneful Threefold Combining Co
- Page 38 and 39:
Archaeological Methods, Archaeometr
- Page 40 and 41:
Archaeological Methods, Archaeometr
- Page 42 and 43:
Archaeological Methods, Archaeometr
- Page 44 and 45:
Figure 2.5. Diagram showing the res
- Page 46 and 47:
Archaeological Methods, Archaeometr
- Page 48 and 49:
Archaeological Methods, Archaeometr
- Page 50 and 51:
Metal Objects and Indigenous Values
- Page 52 and 53:
Metal Objects and Indigenous Values
- Page 54 and 55:
Metal Objects and Indigenous Values
- Page 56 and 57:
Metal Objects and Indigenous Values
- Page 58 and 59:
4 Chert Sourcing in the Northern Le
- Page 60 and 61:
Geochemical Techniques in Discrimin
- Page 62 and 63:
Geochemical Techniques in Discrimin
- Page 64 and 65:
Geochemical Techniques in Discrimin
- Page 66 and 67:
Corbison Point (CP) Central Plain g
- Page 68 and 69:
Geochemical Techniques in Discrimin
- Page 70 and 71:
Geochemical Techniques in Discrimin
- Page 72 and 73:
Geochemical Techniques in Discrimin
- Page 74 and 75:
Table 4.3. Antigua Formation Flints
- Page 76 and 77:
Geochemical Techniques in Discrimin
- Page 78 and 79:
Geochemical Techniques in Discrimin
- Page 80 and 81:
Geochemical Techniques in Discrimin
- Page 82 and 83:
II FUNCTIONAL STUDIES OF ARTIFACTS
- Page 84 and 85:
5 A New Material to View the Past D
- Page 86 and 87:
Dental Alginate Molds of Friable Ar
- Page 88 and 89:
Dental Alginate Molds of Friable Ar
- Page 90 and 91:
Figure 5.3. Weave pattern schematic
- Page 92 and 93:
Dental Alginate Molds of Friable Ar
- Page 94 and 95:
Investigating Stone Bead Drilling T
- Page 96 and 97:
Investigating Stone Bead Drilling T
- Page 98 and 99:
Investigating Stone Bead Drilling T
- Page 100 and 101:
Investigating Stone Bead Drilling T
- Page 102 and 103:
Investigating Stone Bead Drilling T
- Page 104 and 105:
Investigating Stone Bead Drilling T
- Page 106 and 107:
Lithic Technology / 91 Figure 7.1.
- Page 108 and 109:
Lithic Technology / 93 of researche
- Page 110 and 111:
Figure 7.2. a: Vivé, small bipolar
- Page 112 and 113:
Lithic Technology / 97 north. Red j
- Page 114 and 115:
Lithic Technology / 99 Figure 7.4.
- Page 116 and 117:
8 Tool Use and Technological Choice
- Page 118 and 119:
Functional Analysis of Caribbean To
- Page 120 and 121:
Functional Analysis of Caribbean To
- Page 122 and 123:
Functional Analysis of Caribbean To
- Page 124 and 125:
Figure 8.3. Toolkit for the product
- Page 126 and 127:
Functional Analysis of Caribbean To
- Page 128 and 129:
Functional Analysis of Caribbean To
- Page 130 and 131:
9 Understanding the Function of Cor
- Page 132 and 133:
Function of Coral Tools from Anse
- Page 134 and 135:
Function of Coral Tools from Anse
- Page 136 and 137:
Figure 9.4. Matching experimental a
- Page 138 and 139:
Function of Coral Tools from Anse
- Page 140 and 141:
10 The Significance of Wear and Res
- Page 142 and 143:
Significance of Wear and Residue St
- Page 144 and 145:
Significance of Wear and Residue St
- Page 146 and 147:
Significance of Wear and Residue St
- Page 148 and 149:
Figure 10.5. a: starch grain with e
- Page 150 and 151:
Significance of Wear and Residue St
- Page 152 and 153:
11 Starch Residues on Lithic Artifa
- Page 154 and 155:
Starch Residues on Lithic Artifacts
- Page 156 and 157:
Figure 11.2. Lithic tools from Los
- Page 158 and 159:
Table 11.1. Summary of Artifacts Se
- Page 160 and 161:
Starch Residues on Lithic Artifacts
- Page 162 and 163:
Fabaceae 2 6 1 1 10 50% Phaseolus v
- Page 164 and 165:
Figure 11.3. Archaeological starch
- Page 166 and 167:
Figure 11.4. Archaeological starch
- Page 168 and 169:
Starch Residues on Lithic Artifacts
- Page 170 and 171: Starch Residues on Lithic Artifacts
- Page 172 and 173: Dioscorea sp. (pos. domest.) 1 12.5
- Page 174 and 175: 12 The Burén in Precolonial Cuban
- Page 176 and 177: Plants and Ceramic Griddles / 161 p
- Page 178 and 179: Table 12.1. Plant Identi¤cation by
- Page 180 and 181: Plants and Ceramic Griddles / 165 I
- Page 182 and 183: Plants and Ceramic Griddles / 167 m
- Page 184 and 185: Plants and Ceramic Griddles / 169 t
- Page 186 and 187: III NEW TRENDS IN PALEOETHNOBOTANIC
- Page 188 and 189: 13 Caribbean Paleoethnobotany Prese
- Page 190 and 191: Table 13.1. Selected Excerpts and C
- Page 192 and 193: Table 13.2. Plant Taxa Indicated in
- Page 194 and 195: Caribbean Paleoethnobotany / 179 19
- Page 196 and 197: Caribbean Paleoethnobotany / 181 tu
- Page 198 and 199: Archaic Age Early Ceramic Age Later
- Page 200 and 201: Table 13.3. Continued Caribbean Pal
- Page 202 and 203: Caribbean Paleoethnobotany / 187 ch
- Page 204 and 205: Caribbean Paleoethnobotany / 189 co
- Page 206 and 207: Caribbean Paleoethnobotany / 191 ap
- Page 208 and 209: Caribbean Paleoethnobotany / 193 wi
- Page 210 and 211: 14 New Evidence of Two Different Mi
- Page 212 and 213: New Evidence of Two Different Migra
- Page 214 and 215: New Evidence of Two Different Migra
- Page 216 and 217: New Evidence of Two Different Migra
- Page 218 and 219: New Evidence of Two Different Migra
- Page 222 and 223: New Evidence of Two Different Migra
- Page 224 and 225: New Evidence of Two Different Migra
- Page 226 and 227: Table 14.4. Continued CUD ECD CVR O
- Page 228 and 229: New Evidence of Two Different Migra
- Page 230 and 231: Tracing Human Mobility with 87 Sr/
- Page 232 and 233: Tracing Human Mobility with 87 Sr/
- Page 234 and 235: Tracing Human Mobility with 87 Sr/
- Page 236 and 237: Table 15.2. Strontium Ratios of Hum
- Page 238 and 239: Tracing Human Mobility with 87 Sr/
- Page 240 and 241: Tracing Human Mobility with 87 Sr/
- Page 242 and 243: Epilogue / 227 cially apparent when
- Page 244 and 245: Epilogue / 229 nore the diversity t
- Page 246 and 247: Epilogue / 231 derstanding of prehi
- Page 248 and 249: References Cited Abel, T. 1998 Comp
- Page 250 and 251: References Cited / 235 1974 Archéo
- Page 252 and 253: References Cited / 237 Bertouille,
- Page 254 and 255: References Cited / 239 1964 The Arc
- Page 256 and 257: References Cited / 241 Coomans, H.
- Page 258 and 259: References Cited / 243 2005 Caribbe
- Page 260 and 261: References Cited / 245 De Mille, C.
- Page 262 and 263: References Cited / 247 Febles, J.,
- Page 264 and 265: References Cited / 249 a Sicán Bur
- Page 266 and 267: References Cited / 251 Haslam, M. 2
- Page 268 and 269: References Cited / 253 Hofman, C. L
- Page 270 and 271:
References Cited / 255 Lange, H. S.
- Page 272 and 273:
References Cited / 257 Kennedy, M.
- Page 274 and 275:
References Cited / 259 columbian Go
- Page 276 and 277:
References Cited / 261 mental Micro
- Page 278 and 279:
References Cited / 263 Montgomery,
- Page 280 and 281:
References Cited / 265 Norr, L. 200
- Page 282 and 283:
References Cited / 267 1855 by J. A
- Page 284 and 285:
References Cited / 269 Peterson, L.
- Page 286 and 287:
References Cited / 271 of the State
- Page 288 and 289:
References Cited / 273 Roobol, M. J
- Page 290 and 291:
References Cited / 275 Schweingrube
- Page 292 and 293:
References Cited / 277 Sjøvold, T.
- Page 294 and 295:
References Cited / 279 Townsend, G.
- Page 296 and 297:
References Cited / 281 Site on the
- Page 298 and 299:
References Cited / 283 Walker, J. B
- Page 300 and 301:
Contributors Benoît Bérard is Ma
- Page 302 and 303:
Contributors / 287 Wales, U.K. sinc
- Page 304 and 305:
Contributors / 289 chaeology, Leide
- Page 306 and 307:
Index Aceramic Age: peoples of, 195
- Page 308:
Scanning electron microscope/ energ