Annual Report 2012 - Development Securities PLC
Annual Report 2012 - Development Securities PLC
Annual Report 2012 - Development Securities PLC

You also want an ePaper? Increase the reach of your titles
YUMPU automatically turns print PDFs into web optimized ePapers that Google loves.
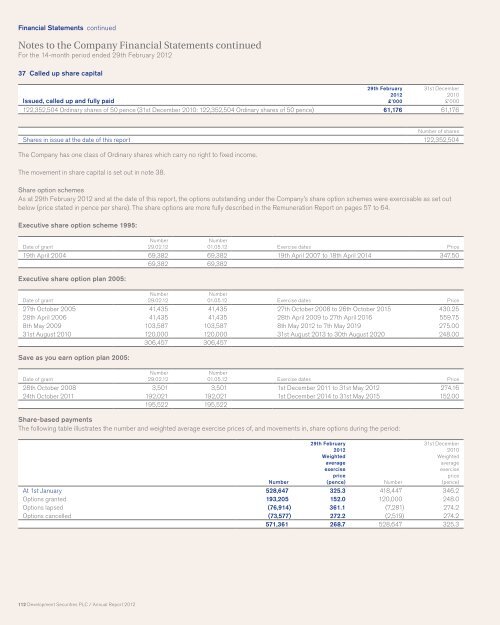
Financial Statements continued<br />
Notes to the Company Financial Statements continued<br />
For the 14-month period ended 29th February <strong>2012</strong><br />
37 Called up share capital<br />
29th February 31st December<br />
Issued, called up and fully paid<br />
<strong>2012</strong><br />
£’000<br />
2010<br />
£’000<br />
122,352,504 Ordinary shares of 50 pence (31st December 2010: 122,352,504 Ordinary shares of 50 pence) 61,176 61,176<br />
Number of shares<br />
Shares in issue at the date of this report 122,352,504<br />
The Company has one class of Ordinary shares which carry no right to fixed income.<br />
The movement in share capital is set out in note 38.<br />
Share option schemes<br />
As at 29th February <strong>2012</strong> and at the date of this report, the options outstanding under the Company’s share option schemes were exercisable as set out<br />
below (price stated in pence per share). The share options are more fully described in the Remuneration <strong>Report</strong> on pages 57 to 64.<br />
Executive share option scheme 1995:<br />
Date of grant<br />
112 <strong>Development</strong> <strong>Securities</strong> <strong>PLC</strong> / <strong>Annual</strong> <strong>Report</strong> <strong>2012</strong><br />
Number<br />
29.02.12<br />
Number<br />
01.05.12 Exercise dates Price<br />
19th April 2004 69,382 69,382 19th April 2007 to 18th April 2014 347.50<br />
69,382 69,382<br />
Executive share option plan 2005:<br />
Date of grant<br />
Number<br />
29.02.12<br />
Number<br />
01.05.12 Exercise dates Price<br />
27th October 2005 41,435 41,435 27th October 2008 to 26th October 2015 430.25<br />
28th April 2006 41,435 41,435 28th April 2009 to 27th April 2016 559.75<br />
8th May 2009 103,587 103,587 8th May <strong>2012</strong> to 7th May 2019 275.00<br />
31st August 2010 120,000 120,000 31st August 2013 to 30th August 2020 248.00<br />
306,457 306,457<br />
Save as you earn option plan 2005:<br />
Date of grant<br />
Number<br />
29.02.12<br />
Number<br />
01.05.12 Exercise dates Price<br />
28th October 2008 3,501 3,501 1st December 2011 to 31st May <strong>2012</strong> 274.16<br />
24th October 2011 192,021 192,021 1st December 2014 to 31st May 2015 152.00<br />
195,522 195,522<br />
Share-based payments<br />
The following table illustrates the number and weighted average exercise prices of, and movements in, share options during the period:<br />
Number<br />
29th February<br />
<strong>2012</strong><br />
Weighted<br />
average<br />
exercise<br />
price<br />
(pence) Number<br />
31st December<br />
2010<br />
Weighted<br />
average<br />
exercise<br />
price<br />
(pence)<br />
At 1st January 528,647 325.3 418,447 346.2<br />
Options granted 193,205 152.0 120,000 248.0<br />
Options lapsed (76,914) 361.1 (7,281) 274.2<br />
Options cancelled (73,577) 272.2 (2,519) 274.2<br />
571,361 268.7 528,647 325.3