Annual Report 2012 - Development Securities PLC
Annual Report 2012 - Development Securities PLC
Annual Report 2012 - Development Securities PLC

You also want an ePaper? Increase the reach of your titles
YUMPU automatically turns print PDFs into web optimized ePapers that Google loves.
Financial Statements<br />
Any options granted on or before 7th November 2002 have not been recognised under FRS 20 under the exemption in that standard. These options have<br />
not been subsequently modified and therefore do not need to be accounted for in accordance with FRS 20.<br />
The weighted average fair value of options granted during the period was £0.50 (31st December 2010: £0.50). The average share price during the period<br />
was 194.1 pence (31st December 2010: 255.0 pence). Of the 571,361 (31st December 2010: 528,647) outstanding options at 29th February <strong>2012</strong>,<br />
155,753 were exercisable (31st December 2010: 229,166).<br />
The options outstanding at 29th February <strong>2012</strong> were exercisable between 152.0 pence and 559.8 pence per share and have a weighted average remaining<br />
contractual life of 5.3 years (31st December 2010: 4.2 years).<br />
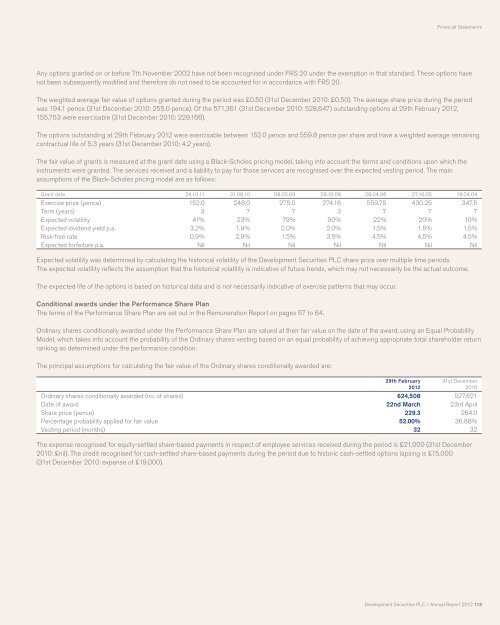
The fair value of grants is measured at the grant date using a Black-Scholes pricing model, taking into account the terms and conditions upon which the<br />
instruments were granted. The services received and a liability to pay for those services are recognised over the expected vesting period. The main<br />
assumptions of the Black-Scholes pricing model are as follows:<br />
Grant date 24.10.11 31.08.10 08.05.09 28.10.08 28.04.06 27.10.05 19.04.04<br />
Exercise price (pence) 152.0 248.0 275.0 274.16 559.75 430.25 347.5<br />
Term (years) 3 7 7 3 7 7 7<br />
Expected volatility 41% 23% 79% 90% 22% 20% 10%<br />
Expected dividend yield p.a. 3.2% 1.9% 2.0% 2.0% 1.5% 1.5% 1.5%<br />
Risk-free rate 0.9% 2.9% 1.5% 3.5% 4.5% 4.5% 4.5%<br />
Expected forfeiture p.a. Nil Nil Nil Nil Nil Nil Nil<br />
Expected volatility was determined by calculating the historical volatility of the <strong>Development</strong> <strong>Securities</strong> <strong>PLC</strong> share price over multiple time periods.<br />
The expected volatility reflects the assumption that the historical volatility is indicative of future trends, which may not necessarily be the actual outcome.<br />
The expected life of the options is based on historical data and is not necessarily indicative of exercise patterns that may occur.<br />
Conditional awards under the Performance Share Plan<br />
The terms of the Performance Share Plan are set out in the Remuneration <strong>Report</strong> on pages 57 to 64.<br />
Ordinary shares conditionally awarded under the Performance Share Plan are valued at their fair value on the date of the award, using an Equal Probability<br />
Model, which takes into account the probability of the Ordinary shares vesting based on an equal probability of achieving appropriate total shareholder return<br />
ranking as determined under the performance condition.<br />
The principal assumptions for calculating the fair value of the Ordinary shares conditionally awarded are:<br />
29th February<br />
<strong>2012</strong><br />
31st December<br />
2010<br />
Ordinary shares conditionally awarded (no. of shares) 624,508 527,621<br />
Date of award 22nd March 23rd April<br />
Share price (pence) 229.3 264.0<br />
Percentage probability applied for fair value 52.00% 36.88%<br />
Vesting period (months) 32 32<br />
The expense recognised for equity-settled share-based payments in respect of employee services received during the period is £21,000 (31st December<br />
2010: £nil). The credit recognised for cash-settled share-based payments during the period due to historic cash-settled options lapsing is £15,000<br />
(31st December 2010: expense of £19,000).<br />
<strong>Development</strong> <strong>Securities</strong> <strong>PLC</strong> / <strong>Annual</strong> <strong>Report</strong> <strong>2012</strong> 113