Annual Report 2012 - Development Securities PLC
Annual Report 2012 - Development Securities PLC
Annual Report 2012 - Development Securities PLC

Create successful ePaper yourself
Turn your PDF publications into a flip-book with our unique Google optimized e-Paper software.
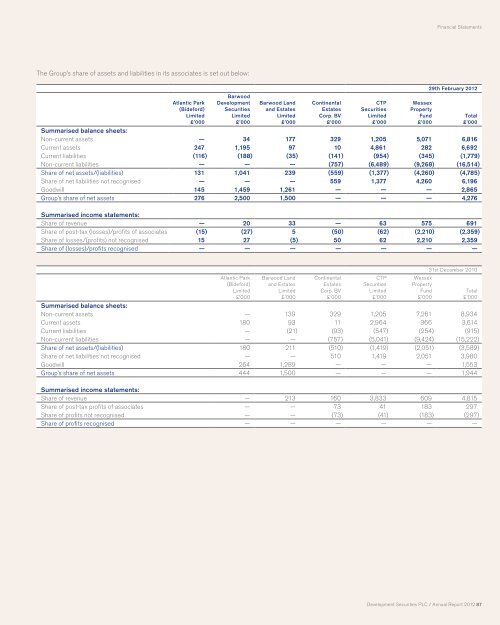
The Group’s share of assets and liabilities in its associates is set out below:<br />
Atlantic Park<br />
(Bideford)<br />
Limited<br />
£’000<br />
Barwood<br />
<strong>Development</strong><br />
<strong>Securities</strong><br />
Limited<br />
£’000<br />
Barwood Land<br />
and Estates<br />
Limited<br />
£’000<br />
Continental<br />
Estates<br />
Corp. BV<br />
£’000<br />
CTP<br />
<strong>Securities</strong><br />
Limited<br />
£’000<br />
Wessex<br />
Property<br />
Fund<br />
£’000<br />
Financial Statements<br />
29th February <strong>2012</strong><br />
Summarised balance sheets:<br />
Non-current assets — 34 177 329 1,205 5,071 6,816<br />
Current assets 247 1,195 97 10 4,861 282 6,692<br />
Current liabilities (116) (188) (35) (141) (954) (345) (1,779)<br />
Non-current liabilities — — — (757) (6,489) (9,268) (16,514)<br />
Share of net assets/(liabilities) 131 1,041 239 (559) (1,377) (4,260) (4,785)<br />
Share of net liabilities not recognised — — — 559 1,377 4,260 6,196<br />
Goodwill 145 1,459 1,261 — — — 2,865<br />
Group’s share of net assets 276 2,500 1,500 — — — 4,276<br />
Summarised income statements:<br />
Share of revenue — 20 33 — 63 575 691<br />
Share of post-tax (losses)/profits of associates (15) (27) 5 (50) (62) (2,210) (2,359)<br />
Share of losses/(profits) not recognised 15 27 (5) 50 62 2,210 2,359<br />
Share of (losses)/profits recognised — — — — — — —<br />
Atlantic Park<br />
(Bideford)<br />
Limited<br />
£’000<br />
Barwood Land<br />
and Estates<br />
Limited<br />
£’000<br />
Continental<br />
Estates<br />
Corp. BV<br />
£’000<br />
CTP<br />
<strong>Securities</strong><br />
Limited<br />
£’000<br />
Wessex<br />
Property<br />
Fund<br />
£’000<br />
Total<br />
£’000<br />
31st December 2010<br />
Summarised balance sheets:<br />
Non-current assets — 139 329 1,205 7,261 8,934<br />
Current assets 180 93 11 2,964 366 3,614<br />
Current liabilities — (21) (93) (547) (254) (915)<br />
Non-current liabilities — — (757) (5,041) (9,424) (15,222)<br />
Share of net assets/(liabilities) 180 211 (510) (1,419) (2,051) (3,589)<br />
Share of net liabilities not recognised — — 510 1,419 2,051 3,980<br />
Goodwill 264 1,289 — — — 1,553<br />
Group’s share of net assets 444 1,500 — — — 1,944<br />
Summarised income statements:<br />
Share of revenue — 213 160 3,833 609 4,815<br />
Share of post-tax profits of associates — — 73 41 183 297<br />
Share of profits not recognised — — (73) (41) (183) (297)<br />
Share of profits recognised — — — — — —<br />
Total<br />
£’000<br />
<strong>Development</strong> <strong>Securities</strong> <strong>PLC</strong> / <strong>Annual</strong> <strong>Report</strong> <strong>2012</strong> 87