Annual Report 2012 - Development Securities PLC
Annual Report 2012 - Development Securities PLC
Annual Report 2012 - Development Securities PLC

You also want an ePaper? Increase the reach of your titles
YUMPU automatically turns print PDFs into web optimized ePapers that Google loves.
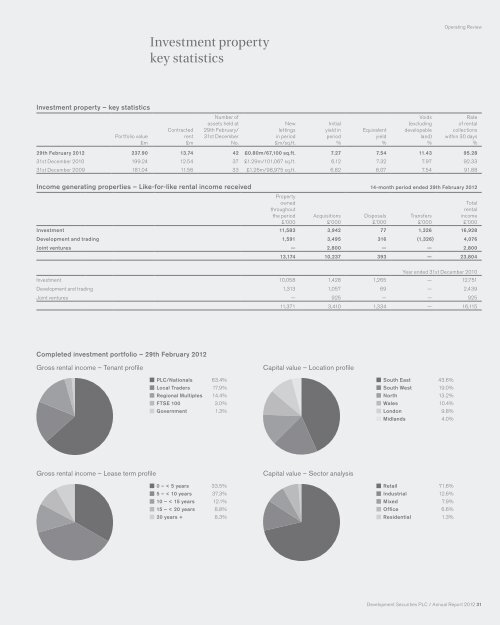
Investment property – key statistics<br />
Portfolio value<br />
£m<br />
Completed investment portfolio – 29th February <strong>2012</strong><br />
Gross rental income – Tenant profile<br />
Gross rental income – Lease term profile<br />
Investment property<br />
key statistics<br />
Contracted<br />
rent<br />
£m<br />
Number of<br />
assets held at<br />
29th February/<br />
31st December<br />
No.<br />
<strong>PLC</strong>/Nationals 63.4%<br />
Local Traders 17.9%<br />
Regional Multiples 14.4%<br />
FTSE 100 3.0%<br />
Government 1.3%<br />
0 – < 5 years 33.5%<br />
5 – < 10 years 37.3%<br />
10 – < 15 years 12.1%<br />
15 – < 20 years 8.8%<br />
20 years + 8.3%<br />
New<br />
lettings<br />
in period<br />
£m/sq.ft.<br />
Initial<br />
yield in<br />
period<br />
%<br />
Capital value – Location profile<br />
Capital value – Sector analysis<br />
Equivalent<br />
yield<br />
%<br />
Voids<br />
(excluding<br />
developable<br />
land)<br />
%<br />
South East 43.6%<br />
South West 19.0%<br />
North 13.2%<br />
Wales 10.4%<br />
London 9.8%<br />
Midlands 4.0%<br />
Retail 71.6%<br />
Industrial 12.6%<br />
Mixed 7.9%<br />
Office 6.6%<br />
Residential 1.3%<br />
Operating Review<br />
Rate<br />
of rental<br />
collections<br />
within 30 days<br />
%<br />
29th February <strong>2012</strong> 237.90 13.74 42 £0.80m/67,100 sq.ft. 7.27 7.54 11.43 95.28<br />
31st December 2010 199.24 12.54 37 £1.29m/101,067 sq.ft. 6.12 7.32 7.97 92.33<br />
31st December 2009 181.04 11.56 33 £1.26m/98,975 sq.ft. 6.82 8.07 7.54 91.88<br />
Income generating properties – Like-for-like rental income received 14-month period ended 29th February <strong>2012</strong><br />
Property<br />
owned<br />
throughout<br />
the period<br />
£’000<br />
Acquisitions<br />
£’000<br />
Disposals<br />
£’000<br />
Transfers<br />
£’000<br />
Investment 11,583 3,942 77 1,326 16,928<br />
<strong>Development</strong> and trading 1,591 3,495 316 (1,326) 4,076<br />
Joint ventures — 2,800 — — 2,800<br />
Total<br />
rental<br />
income<br />
£’000<br />
13,174 10,237 393 — 23,804<br />
Year ended 31st December 2010<br />
Investment 10,058 1,428 1,265 — 12,751<br />
<strong>Development</strong> and trading 1,313 1,057 69 — 2,439<br />
Joint ventures — 925 — — 925<br />
11,371 3,410 1,334 — 16,115<br />
<strong>Development</strong> <strong>Securities</strong> <strong>PLC</strong> / <strong>Annual</strong> <strong>Report</strong> <strong>2012</strong> 31