Annual Report 2012 - Development Securities PLC
Annual Report 2012 - Development Securities PLC
Annual Report 2012 - Development Securities PLC

You also want an ePaper? Increase the reach of your titles
YUMPU automatically turns print PDFs into web optimized ePapers that Google loves.
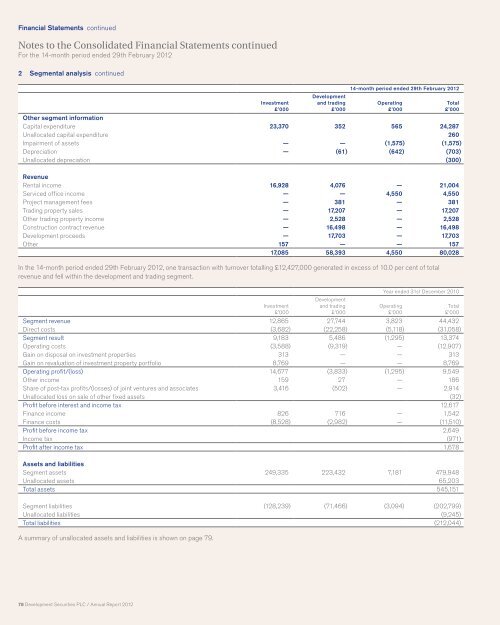
Financial Statements continued<br />
Notes to the Consolidated Financial Statements continued<br />
For the 14-month period ended 29th February <strong>2012</strong><br />
2 Segmental analysis continued<br />
78 <strong>Development</strong> <strong>Securities</strong> <strong>PLC</strong> / <strong>Annual</strong> <strong>Report</strong> <strong>2012</strong><br />
Investment<br />
£’000<br />
<strong>Development</strong><br />
and trading<br />
£’000<br />
14-month period ended 29th February <strong>2012</strong><br />
Operating<br />
£’000<br />
Other segment information<br />
Capital expenditure 23,370 352 565 24,287<br />
Unallocated capital expenditure 260<br />
Impairment of assets — — (1,575) (1,575)<br />
Depreciation — (61) (642) (703)<br />
Unallocated depreciation (300)<br />
Revenue<br />
Rental income 16,928 4,076 — 21,004<br />
Serviced office income — — 4,550 4,550<br />
Project management fees — 381 — 381<br />
Trading property sales — 17,207 — 17,207<br />
Other trading property income — 2,528 — 2,528<br />
Construction contract revenue — 16,498 — 16,498<br />
<strong>Development</strong> proceeds — 17,703 — 17,703<br />
Other 157 — — 157<br />
17,085 58,393 4,550 80,028<br />
In the 14-month period ended 29th February <strong>2012</strong>, one transaction with turnover totalling £12,427,000 generated in excess of 10.0 per cent of total<br />
revenue and fell within the development and trading segment.<br />
Investment<br />
£’000<br />
<strong>Development</strong><br />
and trading<br />
£’000<br />
Total<br />
£’000<br />
Year ended 31st December 2010<br />
Operating<br />
£’000<br />
Segment revenue 12,865 27,744 3,823 44,432<br />
Direct costs (3,682) (22,258) (5,118) (31,058)<br />
Segment result 9,183 5,486 (1,295) 13,374<br />
Operating costs (3,588) (9,319) — (12,907)<br />
Gain on disposal on investment properties 313 — — 313<br />
Gain on revaluation of investment property portfolio 8,769 — — 8,769<br />
Operating profit/(loss) 14,677 (3,833) (1,295) 9,549<br />
Other income 159 27 — 186<br />
Share of post-tax profits/(losses) of joint ventures and associates 3,416 (502) — 2,914<br />
Unallocated loss on sale of other fixed assets (32)<br />
Profit before interest and income tax 12,617<br />
Finance income 826 716 — 1,542<br />
Finance costs (8,528) (2,982) — (11,510)<br />
Profit before income tax 2,649<br />
Income tax (971)<br />
Profit after income tax 1,678<br />
Assets and liabilities<br />
Segment assets 249,335 223,432 7,181 479,948<br />
Unallocated assets 65,203<br />
Total assets 545,151<br />
Segment liabilities (128,239) (71,466) (3,094) (202,799)<br />
Unallocated liabilities (9,245)<br />
Total liabilities (212,044)<br />
A summary of unallocated assets and liabilities is shown on page 79.<br />
Total<br />
£’000