Annual Report 2012 - Development Securities PLC
Annual Report 2012 - Development Securities PLC
Annual Report 2012 - Development Securities PLC

You also want an ePaper? Increase the reach of your titles
YUMPU automatically turns print PDFs into web optimized ePapers that Google loves.
14-month period<br />
ended 29th February<br />
<strong>2012</strong><br />
’000<br />
Financial Statements<br />
Year ended<br />
31st December<br />
2010<br />
’000<br />
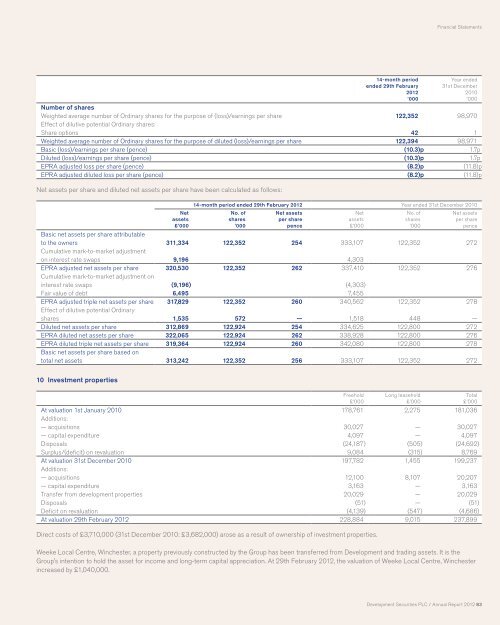
Number of shares<br />
Weighted average number of Ordinary shares for the purpose of (loss)/earnings per share 122,352 98,970<br />
Effect of dilutive potential Ordinary shares:<br />
Share options 42 1<br />
Weighted average number of Ordinary shares for the purpose of diluted (loss)/earnings per share 122,394 98,971<br />
Basic (loss)/earnings per share (pence) (10.3)p 1.7p<br />
Diluted (loss)/earnings per share (pence) (10.3)p 1.7p<br />
EPRA adjusted loss per share (pence) (8.2)p (11.8)p<br />
EPRA adjusted diluted loss per share (pence) (8.2)p (11.8)p<br />
Net assets per share and diluted net assets per share have been calculated as follows:<br />
Net<br />
assets<br />
£’000<br />
14-month period ended 29th February <strong>2012</strong> Year ended 31st December 2010<br />
No. of<br />
shares<br />
’000<br />
Net assets<br />
per share<br />
pence<br />
Net<br />
assets<br />
£’000<br />
No. of<br />
shares<br />
’000<br />
Net assets<br />
per share<br />
pence<br />
Basic net assets per share attributable<br />
to the owners 311,334 122,352 254 333,107 122,352 272<br />
Cumulative mark-to-market adjustment<br />
on interest rate swaps 9,196 4,303<br />
EPRA adjusted net assets per share 320,530 122,352 262 337,410 122,352 276<br />
Cumulative mark-to-market adjustment on<br />
interest rate swaps (9,196) (4,303)<br />
Fair value of debt 6,495 7,455<br />
EPRA adjusted triple net assets per share 317,829 122,352 260 340,562 122,352 278<br />
Effect of dilutive potential Ordinary<br />
shares 1,535 572 — 1,518 448 —<br />
Diluted net assets per share 312,869 122,924 254 334,625 122,800 272<br />
EPRA diluted net assets per share 322,065 122,924 262 338,928 122,800 276<br />
EPRA diluted triple net assets per share 319,364 122,924 260 342,080 122,800 278<br />
Basic net assets per share based on<br />
total net assets 313,242 122,352 256 333,107 122,352 272<br />
10 Investment properties<br />
Freehold<br />
£’000<br />
Long leasehold<br />
£’000<br />
At valuation 1st January 2010 178,761 2,275 181,036<br />
Additions:<br />
— acquisitions 30,027 — 30,027<br />
— capital expenditure 4,097 — 4,097<br />
Disposals (24,187) (505) (24,692)<br />
Surplus/(deficit) on revaluation 9,084 (315) 8,769<br />
At valuation 31st December 2010 197,782 1,455 199,237<br />
Additions:<br />
— acquisitions 12,100 8,107 20,207<br />
— capital expenditure 3,163 — 3,163<br />
Transfer from development properties 20,029 — 20,029<br />
Disposals (51) — (51)<br />
Deficit on revaluation (4,139) (547) (4,686)<br />
At valuation 29th February <strong>2012</strong> 228,884 9,015 237,899<br />
Direct costs of £3,710,000 (31st December 2010: £3,682,000) arose as a result of ownership of investment properties.<br />
Weeke Local Centre, Winchester, a property previously constructed by the Group has been transferred from <strong>Development</strong> and trading assets. It is the<br />
Group's intention to hold the asset for income and long-term capital appreciation. At 29th February <strong>2012</strong>, the valuation of Weeke Local Centre, Winchester<br />
increased by £1,040,000.<br />
Total<br />
£’000<br />
<strong>Development</strong> <strong>Securities</strong> <strong>PLC</strong> / <strong>Annual</strong> <strong>Report</strong> <strong>2012</strong> 83