Annual Report 2012 - Development Securities PLC
Annual Report 2012 - Development Securities PLC
Annual Report 2012 - Development Securities PLC

You also want an ePaper? Increase the reach of your titles
YUMPU automatically turns print PDFs into web optimized ePapers that Google loves.
Financial Statements<br />
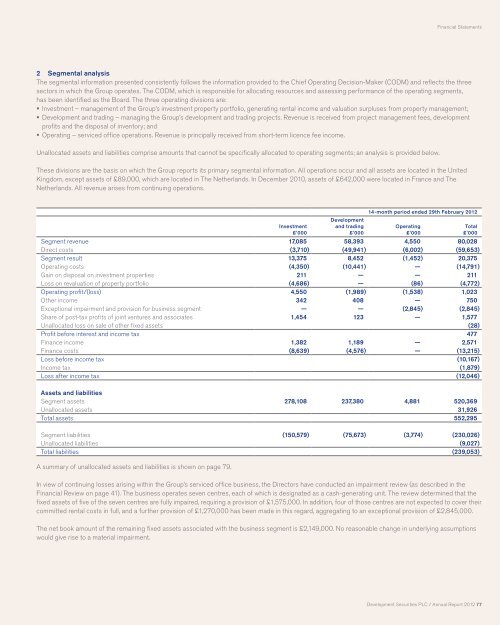
2 Segmental analysis<br />
The segmental information presented consistently follows the information provided to the Chief Operating Decision-Maker (CODM) and reflects the three<br />
sectors in which the Group operates. The CODM, which is responsible for allocating resources and assessing performance of the operating segments,<br />
has been identified as the Board. The three operating divisions are:<br />
Investment – management of the Group’s investment property portfolio, generating rental income and valuation surpluses from property management;<br />
<strong>Development</strong> and trading – managing the Group’s development and trading projects. Revenue is received from project management fees, development<br />
profits and the disposal of inventory; and<br />
Operating – serviced office operations. Revenue is principally received from short-term licence fee income.<br />
Unallocated assets and liabilities comprise amounts that cannot be specifically allocated to operating segments; an analysis is provided below.<br />
These divisions are the basis on which the Group reports its primary segmental information. All operations occur and all assets are located in the United<br />
Kingdom, except assets of £89,000, which are located in The Netherlands. In December 2010, assets of £642,000 were located in France and The<br />
Netherlands. All revenue arises from continuing operations.<br />
Investment<br />
£’000<br />
<strong>Development</strong><br />
and trading<br />
£’000<br />
14-month period ended 29th February <strong>2012</strong><br />
Operating<br />
£’000<br />
Segment revenue 17,085 58,393 4,550 80,028<br />
Direct costs (3,710) (49,941) (6,002) (59,653)<br />
Segment result 13,375 8,452 (1,452) 20,375<br />
Operating costs (4,350) (10,441) — (14,791)<br />
Gain on disposal on investment properties 211 — — 211<br />
Loss on revaluation of property portfolio (4,686) — (86) (4,772)<br />
Operating profit/(loss) 4,550 (1,989) (1,538) 1,023<br />
Other income 342 408 — 750<br />
Exceptional impairment and provision for business segment — — (2,845) (2,845)<br />
Share of post-tax profits of joint ventures and associates 1,454 123 — 1,577<br />
Unallocated loss on sale of other fixed assets (28)<br />
Profit before interest and income tax 477<br />
Finance income 1,382 1,189 — 2,571<br />
Finance costs (8,639) (4,576) — (13,215)<br />
Loss before income tax (10,167)<br />
Income tax (1,879)<br />
Loss after income tax (12,046)<br />
Assets and liabilities<br />
Segment assets 278,108 237,380 4,881 520,369<br />
Unallocated assets 31,926<br />
Total assets 552,295<br />
Segment liabilities (150,579) (75,673) (3,774) (230,026)<br />
Unallocated liabilities (9,027)<br />
Total liabilities (239,053)<br />
A summary of unallocated assets and liabilities is shown on page 79.<br />
In view of continuing losses arising within the Group’s serviced office business, the Directors have conducted an impairment review (as described in the<br />
Financial Review on page 41). The business operates seven centres, each of which is designated as a cash-generating unit. The review determined that the<br />
fixed assets of five of the seven centres are fully impaired, requiring a provision of £1,575,000. In addition, four of those centres are not expected to cover their<br />
committed rental costs in full, and a further provision of £1,270,000 has been made in this regard, aggregating to an exceptional provision of £2,845,000.<br />
The net book amount of the remaining fixed assets associated with the business segment is £2,149,000. No reasonable change in underlying assumptions<br />
would give rise to a material impairment.<br />
Total<br />
£’000<br />
<strong>Development</strong> <strong>Securities</strong> <strong>PLC</strong> / <strong>Annual</strong> <strong>Report</strong> <strong>2012</strong> 77