Landfills and waste water treatment plants as sources of ... - GKSS
Landfills and waste water treatment plants as sources of ... - GKSS
Landfills and waste water treatment plants as sources of ... - GKSS

Create successful ePaper yourself
Turn your PDF publications into a flip-book with our unique Google optimized e-Paper software.
STUDY 1: LANDFILLS AS SOURCES<br />
concentrations may be explained by p<strong>as</strong>sing over highly populated <strong>and</strong> industrial are<strong>as</strong> west<br />
from the sites. This is supported by Dreyer et al. (2009b) in air samples from the same region.<br />
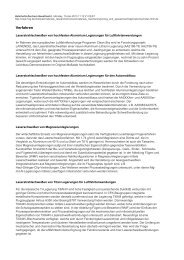
In contr<strong>as</strong>t, the rapid decline in PFC concentrations in samples LB2 <strong>and</strong> RF17 can likely be<br />
attributed to air m<strong>as</strong>ses that arrived with high velocities from co<strong>as</strong>tal regions <strong>and</strong> thus shorter<br />
residence time over those source regions (figure 16b).<br />
a b<br />
Figure 16 a, b: Selected seven days air m<strong>as</strong>s back trajectories calculated for three hours<br />
intervals (arrival height 2 m). Generated by Hysplit 4.8 using GDAS data for sample LB1 (a)<br />
(�PFCs= 706 pg m -3 ) <strong>and</strong> sample LB2 (b) (�PFCs= 134 pg m -3 ). Triangles represent 12 h tags <strong>of</strong><br />
every trajectory. In addition, trajectory heights are plotted.<br />
Taken the prevailing wind direction in account, it can be <strong>as</strong>sumed that during the sampling<br />
periods RFs were not contaminated by the l<strong>and</strong>fills itsselves or by other potential <strong>sources</strong> that<br />
are located between these sites. Thus, trajectory analysis supports the <strong>as</strong>sumption that volatile<br />
<strong>and</strong> semi-volatile PFCs originated from the l<strong>and</strong>fills.<br />
Ionic PFCs from particle ph<strong>as</strong>e determined in this study are in the same range <strong>as</strong> those<br />
observed by Harada et al. (2005) for a rural region <strong>of</strong> Japan. However, PFOS <strong>and</strong> PFOA<br />
concentrations were more than two orders <strong>of</strong> magnitude lower than those <strong>of</strong> Barber at al.<br />
(2007) <strong>and</strong> Harada et al. (2005) in urban are<strong>as</strong> <strong>of</strong> UK <strong>and</strong> Japan, respectively. In contr<strong>as</strong>t to<br />
other studies <strong>of</strong> Dreyer et al. (2009b) <strong>and</strong> Barber et al. (2007), who observed PFOS <strong>and</strong><br />
PFOA in maximum proportions, PFBA w<strong>as</strong> the most dominant compound in this study.<br />
However, in samples LA3, LA4 <strong>and</strong> LB4 PFHxA w<strong>as</strong> detected in highest proportions. For<br />
ionic PFCs distinct differences between l<strong>and</strong>fills <strong>and</strong> their corresponding RFs were not<br />
observed. Moreover, samples are characterized with high variation in concentrations <strong>and</strong><br />
proportions indicating an enhanced uncertainty <strong>of</strong> these data, probably due to revolatilisation<br />
<strong>of</strong> PFCAs from GFF (Arp <strong>and</strong> Goss 2008).<br />
Musk fragrances were detected predominantly in the g<strong>as</strong> ph<strong>as</strong>e which confirms other studies<br />
(Peck <strong>and</strong> Hornbuckle 2004; Peck <strong>and</strong> Hornbuckle 2006; Xie et al. 2007). In general, total<br />
61