Landfills and waste water treatment plants as sources of ... - GKSS
Landfills and waste water treatment plants as sources of ... - GKSS
Landfills and waste water treatment plants as sources of ... - GKSS

Create successful ePaper yourself
Turn your PDF publications into a flip-book with our unique Google optimized e-Paper software.
STUDY 2: WASTE WATER TREATMENT PLANTS AS SOURCES<br />
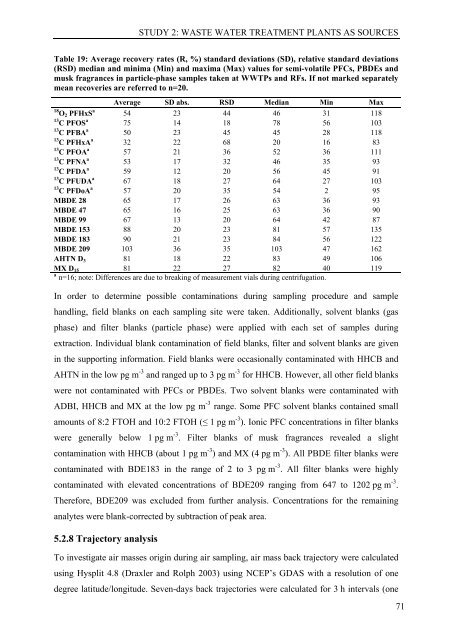
Table 19: Average recovery rates (R, %) st<strong>and</strong>ard deviations (SD), relative st<strong>and</strong>ard deviations<br />
(RSD) median <strong>and</strong> minima (Min) <strong>and</strong> maxima (Max) values for semi-volatile PFCs, PBDEs <strong>and</strong><br />
musk fragrances in particle-ph<strong>as</strong>e samples taken at WWTPs <strong>and</strong> RFs. If not marked separately<br />
mean recoveries are referred to n=20.<br />
Average SD abs. RSD Median Min Max<br />
18 O2 PFHxS a 54 23 44 46 31 118<br />
13 C PFOS a 75 14 18 78 56 103<br />
13 C PFBA a 50 23 45 45 28 118<br />
13 C PFHxA a 32 22 68 20 16 83<br />
13 C PFOA a 57 21 36 52 36 111<br />
13 C PFNA a 53 17 32 46 35 93<br />
13 C PFDA a 59 12 20 56 45 91<br />
13 C PFUDA a 67 18 27 64 27 103<br />
13 C PFDoA a 57 20 35 54 2 95<br />
MBDE 28 65 17 26 63 36 93<br />
MBDE 47 65 16 25 63 36 90<br />
MBDE 99 67 13 20 64 42 87<br />
MBDE 153 88 20 23 81 57 135<br />
MBDE 183 90 21 23 84 56 122<br />
MBDE 209 103 36 35 103 47 162<br />
AHTN D3 81 18 22 83 49 106<br />
MX D15 81 22 27 82 40 119<br />
a n=16; note: Differences are due to breaking <strong>of</strong> me<strong>as</strong>urement vials during centrifugation.<br />
In order to determine possible contaminations during sampling procedure <strong>and</strong> sample<br />
h<strong>and</strong>ling, field blanks on each sampling site were taken. Additionally, solvent blanks (g<strong>as</strong><br />
ph<strong>as</strong>e) <strong>and</strong> filter blanks (particle ph<strong>as</strong>e) were applied with each set <strong>of</strong> samples during<br />
extraction. Individual blank contamination <strong>of</strong> field blanks, filter <strong>and</strong> solvent blanks are given<br />
in the supporting information. Field blanks were occ<strong>as</strong>ionally contaminated with HHCB <strong>and</strong><br />
AHTN in the low pg m -3 <strong>and</strong> ranged up to 3 pg m -3 for HHCB. However, all other field blanks<br />
were not contaminated with PFCs or PBDEs. Two solvent blanks were contaminated with<br />
ADBI, HHCB <strong>and</strong> MX at the low pg m -3 range. Some PFC solvent blanks contained small<br />
amounts <strong>of</strong> 8:2 FTOH <strong>and</strong> 10:2 FTOH (� 1 pg m -3 ). Ionic PFC concentrations in filter blanks<br />
were generally below 1 pg m -3 . Filter blanks <strong>of</strong> musk fragrances revealed a slight<br />
contamination with HHCB (about 1 pg m -3 ) <strong>and</strong> MX (4 pg m -3 ). All PBDE filter blanks were<br />
contaminated with BDE183 in the range <strong>of</strong> 2 to 3 pg m -3 . All filter blanks were highly<br />
contaminated with elevated concentrations <strong>of</strong> BDE209 ranging from 647 to 1202 pg m -3 .<br />
Therefore, BDE209 w<strong>as</strong> excluded from further analysis. Concentrations for the remaining<br />
analytes were blank-corrected by subtraction <strong>of</strong> peak area.<br />
5.2.8 Trajectory analysis<br />
To investigate air m<strong>as</strong>ses origin during air sampling, air m<strong>as</strong>s back trajectory were calculated<br />
using Hysplit 4.8 (Draxler <strong>and</strong> Rolph 2003) using NCEP’s GDAS with a resolution <strong>of</strong> one<br />
degree latitude/longitude. Seven-days back trajectories were calculated for 3 h intervals (one<br />
71