Landfills and waste water treatment plants as sources of ... - GKSS
Landfills and waste water treatment plants as sources of ... - GKSS
Landfills and waste water treatment plants as sources of ... - GKSS
You also want an ePaper? Increase the reach of your titles
YUMPU automatically turns print PDFs into web optimized ePapers that Google loves.
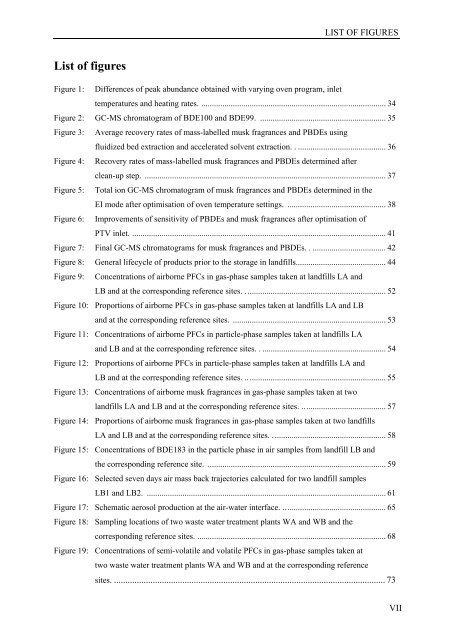
List <strong>of</strong> figures<br />
LIST OF FIGURES<br />
Figure 1: Differences <strong>of</strong> peak abundance obtained with varying oven program, inlet<br />
temperatures <strong>and</strong> heating rates. ........................................................................................ 34<br />
Figure 2: GC-MS chromatogram <strong>of</strong> BDE100 <strong>and</strong> BDE99. ............................................................ 35<br />
Figure 3: Average recovery rates <strong>of</strong> m<strong>as</strong>s-labelled musk fragrances <strong>and</strong> PBDEs using<br />
fluidized bed extraction <strong>and</strong> accelerated solvent extraction. . .......................................... 36<br />
Figure 4: Recovery rates <strong>of</strong> m<strong>as</strong>s-labelled musk fragrances <strong>and</strong> PBDEs determined after<br />
clean-up step. ................................................................................................................... 37<br />
Figure 5: Total ion GC-MS chromatogram <strong>of</strong> musk fragrances <strong>and</strong> PBDEs determined in the<br />
EI mode after optimisation <strong>of</strong> oven temperature settings. ............................................... 38<br />
Figure 6: Improvements <strong>of</strong> sensitivity <strong>of</strong> PBDEs <strong>and</strong> musk fragrances after optimisation <strong>of</strong><br />
PTV inlet. ......................................................................................................................... 41<br />
Figure 7: Final GC-MS chromatograms for musk fragrances <strong>and</strong> PBDEs. . ................................... 42<br />
Figure 8: General lifecycle <strong>of</strong> products prior to the storage in l<strong>and</strong>fills........................................... 44<br />
Figure 9: Concentrations <strong>of</strong> airborne PFCs in g<strong>as</strong>-ph<strong>as</strong>e samples taken at l<strong>and</strong>fills LA <strong>and</strong><br />
LB <strong>and</strong> at the corresponding reference sites. ................................................................... 52<br />
Figure 10: Proportions <strong>of</strong> airborne PFCs in g<strong>as</strong>-ph<strong>as</strong>e samples taken at l<strong>and</strong>fills LA <strong>and</strong> LB<br />
<strong>and</strong> at the corresponding reference sites. ......................................................................... 53<br />
Figure 11: Concentrations <strong>of</strong> airborne PFCs in particle-ph<strong>as</strong>e samples taken at l<strong>and</strong>fills LA<br />
<strong>and</strong> LB <strong>and</strong> at the corresponding reference sites. . ........................................................... 54<br />
Figure 12: Proportions <strong>of</strong> airborne PFCs in particle-ph<strong>as</strong>e samples taken at l<strong>and</strong>fills LA <strong>and</strong><br />
LB <strong>and</strong> at the corresponding reference sites. ................................................................... 55<br />
Figure 13: Concentrations <strong>of</strong> airborne musk fragrances in g<strong>as</strong>-ph<strong>as</strong>e samples taken at two<br />
l<strong>and</strong>fills LA <strong>and</strong> LB <strong>and</strong> at the corresponding reference sites. ........................................ 57<br />
Figure 14: Proportions <strong>of</strong> airborne musk fragrances in g<strong>as</strong>-ph<strong>as</strong>e samples taken at two l<strong>and</strong>fills<br />
LA <strong>and</strong> LB <strong>and</strong> at the corresponding reference sites. ...................................................... 58<br />
Figure 15: Concentrations <strong>of</strong> BDE183 in the particle ph<strong>as</strong>e in air samples from l<strong>and</strong>fill LB <strong>and</strong><br />
the corresponding reference site. ..................................................................................... 59<br />
Figure 16: Selected seven days air m<strong>as</strong>s back trajectories calculated for two l<strong>and</strong>fill samples<br />
LB1 <strong>and</strong> LB2. .................................................................................................................. 61<br />
Figure 17: Schematic aerosol production at the air-<strong>water</strong> interface. ................................................. 65<br />
Figure 18: Sampling locations <strong>of</strong> two <strong>w<strong>as</strong>te</strong> <strong>water</strong> <strong>treatment</strong> <strong>plants</strong> WA <strong>and</strong> WB <strong>and</strong> the<br />
corresponding reference sites. .......................................................................................... 68<br />
Figure 19: Concentrations <strong>of</strong> semi-volatile <strong>and</strong> volatile PFCs in g<strong>as</strong>-ph<strong>as</strong>e samples taken at<br />
two <strong>w<strong>as</strong>te</strong> <strong>water</strong> <strong>treatment</strong> <strong>plants</strong> WA <strong>and</strong> WB <strong>and</strong> at the corresponding reference<br />
sites. ....................................................................................................................... 73<br />
VII


