Landfills and waste water treatment plants as sources of ... - GKSS
Landfills and waste water treatment plants as sources of ... - GKSS
Landfills and waste water treatment plants as sources of ... - GKSS

Create successful ePaper yourself
Turn your PDF publications into a flip-book with our unique Google optimized e-Paper software.
STUDY 2: WASTE WATER TREATMENT PLANTS AS SOURCES<br />
detailed list <strong>of</strong> PFC detection <strong>and</strong> quantification limits is given in supporting information<br />
(PFCs) <strong>and</strong> in section 3.3.4 (PBDEs <strong>and</strong> musk fragrances).<br />
5.2.7 Quality <strong>as</strong>surance <strong>and</strong> quality control<br />
All sample preparations <strong>and</strong> extractions were performed in a clean lab cl<strong>as</strong>s 10000. PFC<br />
containing labware were avoided. Gl<strong>as</strong>sware w<strong>as</strong> dish-w<strong>as</strong>hed <strong>and</strong> heated at 250 °C for at<br />
le<strong>as</strong>t 10 h. Prior to the sampling, GFF were baked at 400 °C for at le<strong>as</strong>t 12 h. PUF/XAD-<br />
2/PUF cartridges were thoroughly cleaned using acetone/MTBE 1:1 for PFC samples <strong>and</strong><br />
hexane/acetone 1:1 for PBDE <strong>and</strong> musk fragrance samples. All st<strong>and</strong>ard solutions were only<br />
used at room temperature. Seven point calibrations (GC-MS: 2, 4, 10, 20, 50, 100,<br />
200 pg μL -1 ; HPLC-MS/MS: 1, 5, 10, 25, 50, 100, 500 pg μL -1 ) were used to quantify target<br />
analytes. Linearity w<strong>as</strong> tested according to DIN 32645 (1994). M<strong>as</strong>s-labelled st<strong>and</strong>ards were<br />
used to correct for analyte losses during analysis <strong>and</strong> me<strong>as</strong>urements.<br />
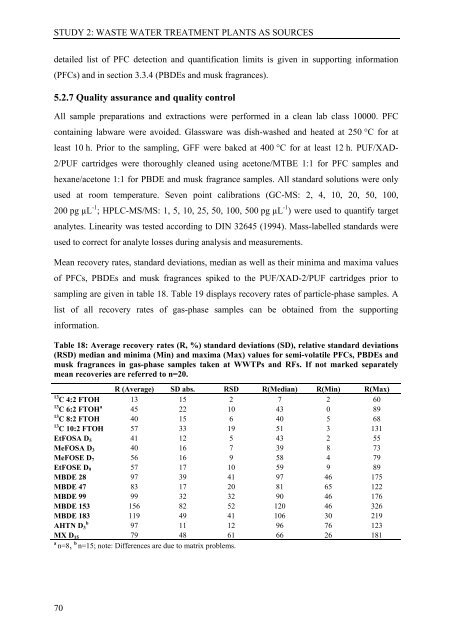
Mean recovery rates, st<strong>and</strong>ard deviations, median <strong>as</strong> well <strong>as</strong> their minima <strong>and</strong> maxima values<br />
<strong>of</strong> PFCs, PBDEs <strong>and</strong> musk fragrances spiked to the PUF/XAD-2/PUF cartridges prior to<br />
sampling are given in table 18. Table 19 displays recovery rates <strong>of</strong> particle-ph<strong>as</strong>e samples. A<br />
list <strong>of</strong> all recovery rates <strong>of</strong> g<strong>as</strong>-ph<strong>as</strong>e samples can be obtained from the supporting<br />
information.<br />
Table 18: Average recovery rates (R, %) st<strong>and</strong>ard deviations (SD), relative st<strong>and</strong>ard deviations<br />
(RSD) median <strong>and</strong> minima (Min) <strong>and</strong> maxima (Max) values for semi-volatile PFCs, PBDEs <strong>and</strong><br />
musk fragrances in g<strong>as</strong>-ph<strong>as</strong>e samples taken at WWTPs <strong>and</strong> RFs. If not marked separately<br />
mean recoveries are referred to n=20.<br />
R (Average) SD abs. RSD R(Median) R(Min) R(Max)<br />
13 C 4:2 FTOH 13 15 2 7 2 60<br />
13 C 6:2 FTOH a 45 22 10 43 0 89<br />
13 C 8:2 FTOH 40 15 6 40 5 68<br />
13 C 10:2 FTOH 57 33 19 51 3 131<br />
EtFOSA D5 41 12 5 43 2 55<br />
MeFOSA D3 40 16 7 39 8 73<br />
MeFOSE D7 56 16 9 58 4 79<br />
EtFOSE D9 57 17 10 59 9 89<br />
MBDE 28 97 39 41 97 46 175<br />
MBDE 47 83 17 20 81 65 122<br />
MBDE 99 99 32 32 90 46 176<br />
MBDE 153 156 82 52 120 46 326<br />
MBDE 183 119 49 41 106 30 219<br />
AHTN D3 b 97 11 12 96 76 123<br />
MX D15 79 48 61 66 26 181<br />
a n=8, b n=15; note: Differences are due to matrix problems.<br />
70