

Violation in Mixing
Violation in Mixing
Violation in Mixing

You also want an ePaper? Increase the reach of your titles
YUMPU automatically turns print PDFs into web optimized ePapers that Google loves.
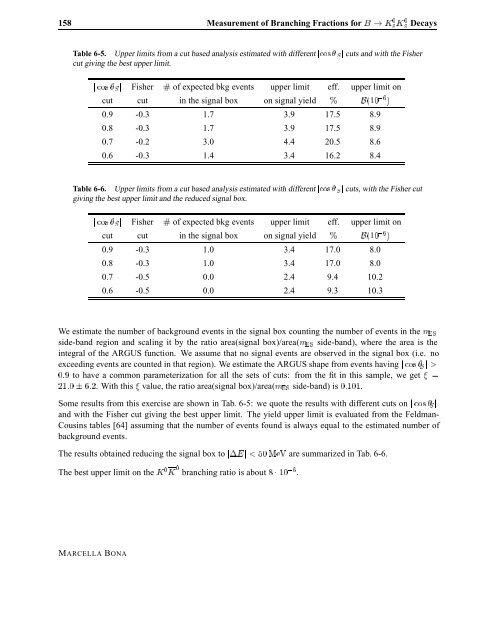
158 Measurement of Branch<strong>in</strong>g Fractions for � � Ã Ë Ã Ë Decays<br />
Table 6-5. Upper limits from a cut based analysis estimated with different � Ó× � Ë� cuts and with the Fisher<br />
cut giv<strong>in</strong>g the best upper limit.<br />
� Ó× �Ë� Fisher � of expected bkg events upper limit eff. upper limit on<br />
cut cut <strong>in</strong> the signal box on signal yield � �<br />
0.9 -0.3 1.7 3.9 17.5 8.9<br />
0.8 -0.3 1.7 3.9 17.5 8.9<br />
0.7 -0.2 3.0 4.4 20.5 8.6<br />
0.6 -0.3 1.4 3.4 16.2 8.4<br />
Table 6-6. Upper limits from a cut based analysis estimated with different � Ó× � Ë� cuts, with the Fisher cut<br />
giv<strong>in</strong>g the best upper limit and the reduced signal box.<br />
� Ó× �Ë� Fisher � of expected bkg events upper limit eff. upper limit on<br />
cut cut <strong>in</strong> the signal box on signal yield � �<br />
0.9 -0.3 1.0 3.4 17.0 8.0<br />
0.8 -0.3 1.0 3.4 17.0 8.0<br />
0.7 -0.5 0.0 2.4 9.4 10.2<br />
0.6 -0.5 0.0 2.4 9.3 10.3<br />
We estimate the number of background events <strong>in</strong> the signal box count<strong>in</strong>g the number of events <strong>in</strong> the Ñ�Ë<br />
side-band region and scal<strong>in</strong>g it by the ratio area(signal box)/area(Ñ�Ë side-band), where the area is the<br />
<strong>in</strong>tegral of the ARGUS function. We assume that no signal events are observed <strong>in</strong> the signal box (i.e. no<br />
exceed<strong>in</strong>g events are counted <strong>in</strong> that region). We estimate the ARGUS shape from events hav<strong>in</strong>g � Ó× �Ë� �<br />
�� to have a common parameterization for all the sets of cuts: from the fit <strong>in</strong> this sample, we get � �<br />
� ¦ �� . With this � value, the ratio area(signal box)/area(Ñ�Ë side-band) is � .<br />
Some results from this exercise are shown <strong>in</strong> Tab. 6-5: we quote the results with different cuts on � Ó× �Ë�<br />
and with the Fisher cut giv<strong>in</strong>g the best upper limit. The yield upper limit is evaluated from the Feldman-<br />
Cous<strong>in</strong>s tables [64] assum<strong>in</strong>g that the number of events found is always equal to the estimated number of<br />
background events.<br />
The results obta<strong>in</strong>ed reduc<strong>in</strong>g the signal box to �¡�� � � Å�Î are summarized <strong>in</strong> Tab. 6-6.<br />
The best upper limit on the à à branch<strong>in</strong>g ratio is about � ¡ � .<br />
MARCELLA BONA


