

Violation in Mixing
Violation in Mixing
Violation in Mixing

You also want an ePaper? Increase the reach of your titles
YUMPU automatically turns print PDFs into web optimized ePapers that Google loves.
7.10 Systematic studies 197<br />
Category Float<strong>in</strong>g Nom<strong>in</strong>al<br />
�Ä�ÔØÓÒ ÊÙÒ � � ¦ � � � (fixed)<br />
�Ã�ÓÒ ÊÙÒ � � ¦ � � � �� (fixed)<br />
�ÆÌ ÊÙÒ � �� ¦ � � � � (fixed)<br />
�ÆÌ ÊÙÒ � ¦ � � � (fixed)<br />
�Ä�ÔØÓÒ ÊÙÒ � ¦ � � � (fixed)<br />
�Ã�ÓÒ ÊÙÒ � � ¦ � �� � �� (fixed)<br />
�ÆÌ ÊÙÒ � �� ¦ � � � (fixed)<br />
�ÆÌ ÊÙÒ � � ¦ � � � � (fixed)<br />
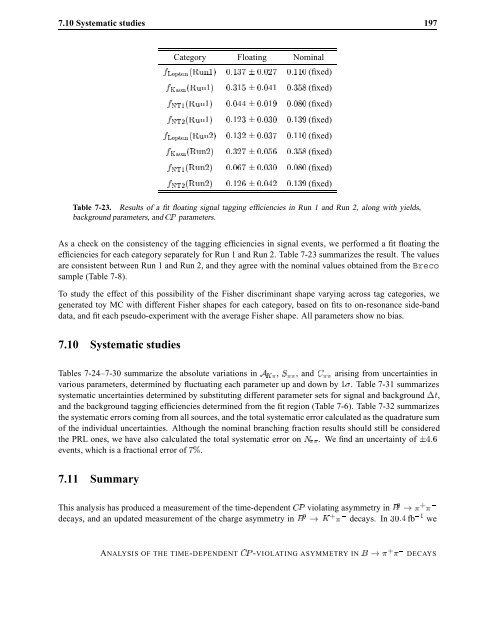
Table 7-23. Results of a fit float<strong>in</strong>g signal tagg<strong>in</strong>g efficiencies <strong>in</strong> Run 1 and Run 2, along with yields,<br />
background parameters, and �È parameters.<br />
As a check on the consistency of the tagg<strong>in</strong>g efficiencies <strong>in</strong> signal events, we performed a fit float<strong>in</strong>g the<br />
efficiencies for each category separately for Run 1 and Run 2. Table 7-23 summarizes the result. The values<br />
are consistent between Run 1 and Run 2, and they agree with the nom<strong>in</strong>al values obta<strong>in</strong>ed from the Breco<br />
sample (Table 7-8).<br />
To study the effect of this possibility of the Fisher discrim<strong>in</strong>ant shape vary<strong>in</strong>g across tag categories, we<br />
generated toy MC with different Fisher shapes for each category, based on fits to on-resonance side-band<br />
data, and fit each pseudo-experiment with the average Fisher shape. All parameters show no bias.<br />
7.10 Systematic studies<br />
Tables 7-24–7-30 summarize the absolute variations <strong>in</strong> �Ã�, Ë��, and ��� aris<strong>in</strong>g from uncerta<strong>in</strong>ties <strong>in</strong><br />
various parameters, determ<strong>in</strong>ed by fluctuat<strong>in</strong>g each parameter up and down by �. Table 7-31 summarizes<br />
systematic uncerta<strong>in</strong>ties determ<strong>in</strong>ed by substitut<strong>in</strong>g different parameter sets for signal and background ¡Ø,<br />
and the background tagg<strong>in</strong>g efficiencies determ<strong>in</strong>ed from the fit region (Table 7-6). Table 7-32 summarizes<br />
the systematic errors com<strong>in</strong>g from all sources, and the total systematic error calculated as the quadrature sum<br />
of the <strong>in</strong>dividual uncerta<strong>in</strong>ties. Although the nom<strong>in</strong>al branch<strong>in</strong>g fraction results should still be considered<br />
the PRL ones, we have also calculated the total systematic error on Æ��. We f<strong>in</strong>d an uncerta<strong>in</strong>ty of ¦���<br />
events, which is a fractional error of � .<br />
7.11 Summary<br />
This analysis has produced a measurement of the time-dependent �È violat<strong>in</strong>g asymmetry <strong>in</strong> � � � �<br />
decays, and an updated measurement of the charge asymmetry <strong>in</strong> � � à � decays. In �� fb we<br />
ANALYSIS OF THE TIME-DEPENDENT �È -VIOLATING ASYMMETRY IN � � � � DECAYS


