

Violation in Mixing
Violation in Mixing
Violation in Mixing

You also want an ePaper? Increase the reach of your titles
YUMPU automatically turns print PDFs into web optimized ePapers that Google loves.
176 Analysis of the time-dependent �È -violat<strong>in</strong>g asymmetry <strong>in</strong> � � � � decays<br />
Sample Lepton Kaon NT1 NT2 Untagged<br />
� � MC � ¦ �� �� ¦ �� ��� ¦ � �� ¦ �� � ¦ ��<br />
à � MC �� ¦ �� �� ¦ �� ��� ¦ � ��� ¦ �� � ¦ ��<br />
à à MC �� ¦ �� �� ¦ �� ��� ¦ � ��� ¦ �� ��� ¦ ��<br />
Run 1 � � �� ¦ �� �� ¦ �� ��� ¦ �� � ¦ � �� ¦ ��<br />
Run 2 � � � ¦ �� �� ¦ ��� ��� ¦ � �� ¦ �� ��� ¦ ���<br />
Run1+2Breco � ¦ � ��� ¦ �� �� ¦ � �� ¦ �� � ¦ ��<br />
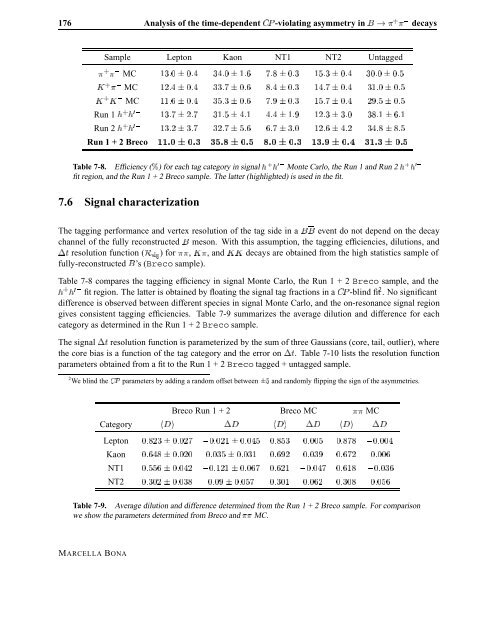
Table 7-8. Efficiency ( ) for each tag category <strong>in</strong> signal � � Monte Carlo, the Run 1 and Run 2 � �<br />
fit region, and the Run 1 + 2 Breco sample. The latter (highlighted) is used <strong>in</strong> the fit.<br />
7.6 Signal characterization<br />
The tagg<strong>in</strong>g performance and vertex resolution of the tag side <strong>in</strong> a �� event do not depend on the decay<br />
channel of the fully reconstructed � meson. With this assumption, the tagg<strong>in</strong>g efficiencies, dilutions, and<br />
¡Ø resolution function (Ê×��) for ��, Ã�, and Ãà decays are obta<strong>in</strong>ed from the high statistics sample of<br />
fully-reconstructed �’s (Breco sample).<br />
Table 7-8 compares the tagg<strong>in</strong>g efficiency <strong>in</strong> signal Monte Carlo, the Run 1 + 2 Breco sample, and the<br />
� � fit region. The latter is obta<strong>in</strong>ed by float<strong>in</strong>g the signal tag fractions <strong>in</strong> a �È -bl<strong>in</strong>d fit 2 . No significant<br />
difference is observed between different species <strong>in</strong> signal Monte Carlo, and the on-resonance signal region<br />
gives consistent tagg<strong>in</strong>g efficiencies. Table 7-9 summarizes the average dilution and difference for each<br />
category as determ<strong>in</strong>ed <strong>in</strong> the Run 1+2Breco sample.<br />
The signal ¡Ø resolution function is parameterized by the sum of three Gaussians (core, tail, outlier), where<br />
the core bias is a function of the tag category and the error on ¡Ø. Table 7-10 lists the resolution function<br />
parameters obta<strong>in</strong>ed from a fit to the Run 1+2Breco tagged + untagged sample.<br />
2 We bl<strong>in</strong>d the �È parameters by add<strong>in</strong>g a random offset between ¦� and randomly flipp<strong>in</strong>g the sign of the asymmetries.<br />
Breco Run 1 + 2 Breco MC �� MC<br />
Category ��� ¡� ��� ¡� ��� ¡�<br />
Lepton �� ¦ � � � ¦ � �� ��� � � ���� � �<br />
Kaon ���� ¦ � � � ¦ � ��� � � ��� � �<br />
NT1 ���� ¦ � � � ¦ � �� �� � �� �� � � �<br />
NT2 � ¦ � � � � ¦ � �� � � � � � � ��<br />
Table 7-9. Average dilution and difference determ<strong>in</strong>ed from the Run 1+2Breco sample. For comparison<br />
we show the parameters determ<strong>in</strong>ed from Breco and �� MC.<br />
MARCELLA BONA


