Business Potential for Agricultural Biotechnology - Asian Productivity ...
Business Potential for Agricultural Biotechnology - Asian Productivity ...
Business Potential for Agricultural Biotechnology - Asian Productivity ...

Create successful ePaper yourself
Turn your PDF publications into a flip-book with our unique Google optimized e-Paper software.
<strong>Business</strong> <strong>Potential</strong> <strong>for</strong> <strong>Agricultural</strong> <strong>Biotechnology</strong> Products in the Philippines<br />
seeds, and perceived health and environmental hazards. As other corn transgenics enter the<br />
country, adoption of a particular variety may depend on the cost-competitiveness of the seeds.<br />
Gonzales (2004) recommends in<strong>for</strong>mation/education campaigns, techno demos, and workshops<br />
on integrated pest management, proactive financing to cover the cost of fertilizer and seeds, providing<br />
the needed public and private investments in infrastructure and back-up services in strategic<br />
corn-producing provinces, market-matching activities and linkages with the livestock-poultry<br />
subsectors to increase the efficiency and global competitiveness of the feedgrain-livestockpoultry<br />
industry cluster, and a sustained, ongoing system of evaluation and socio-economic<br />
impact assessment of YieldGard and other transgenic technologies to help technology generators<br />
and the public in strengthening the strategic position of Bt corn as the key result area in developing<br />
a globally competitive feed corn-livestock industry cluster.<br />
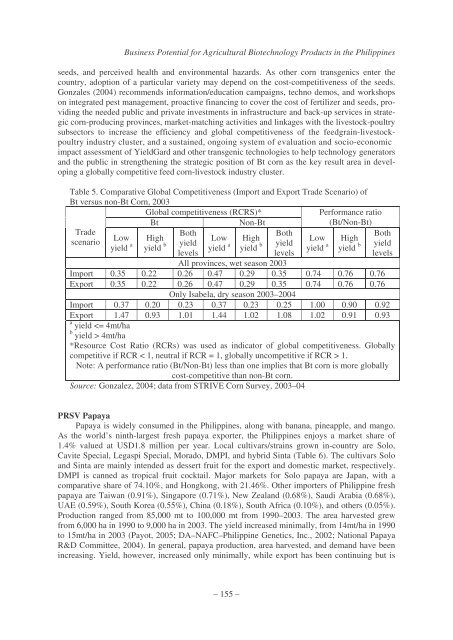
Table 5. Comparative Global Competitiveness (Import and Export Trade Scenario) of<br />
Bt versus non-Bt Corn, 2003<br />
Global competitiveness (RCRS)*<br />
Per<strong>for</strong>mance ratio<br />
Bt Non-Bt<br />
(Bt/Non-Bt)<br />
Trade<br />
scenario<br />
Low<br />
yield a<br />
High<br />
yield b<br />
Both<br />
Low<br />
yield<br />
yield<br />
levels<br />
a<br />
High<br />
yield b<br />
Both<br />
Low<br />
yield<br />
yield<br />
levels<br />
a<br />
High<br />
yield b<br />
Both<br />
yield<br />
levels<br />
All provinces, wet season 2003<br />
Import 0.35 0.22 0.26 0.47 0.29 0.35 0.74 0.76 0.76<br />
Export 0.35 0.22 0.26 0.47 0.29 0.35 0.74 0.76 0.76<br />
Only Isabela, dry season 2003–2004<br />
Import 0.37 0.20 0.23 0.37 0.23 0.25 1.00 0.90 0.92<br />
Export 1.47 0.93 1.01 1.44 1.02 1.08 1.02 0.91 0.93<br />
a<br />
yield 4mt/ha<br />
*Resource Cost Ratio (RCRs) was used as indicator of global competitiveness. Globally<br />
competitive if RCR < 1, neutral if RCR = 1, globally uncompetitive if RCR > 1.<br />
Note: A per<strong>for</strong>mance ratio (Bt/Non-Bt) less than one implies that Bt corn is more globally<br />
cost-competitive than non-Bt corn.<br />
Source: Gonzalez, 2004; data from STRIVE Corn Survey, 2003–04<br />
PRSV Papaya<br />
Papaya is widely consumed in the Philippines, along with banana, pineapple, and mango.<br />
As the world’s ninth-largest fresh papaya exporter, the Philippines enjoys a market share of<br />
1.4% valued at USD1.8 million per year. Local cultivars/strains grown in-country are Solo,<br />
Cavite Special, Legaspi Special, Morado, DMPI, and hybrid Sinta (Table 6). The cultivars Solo<br />
and Sinta are mainly intended as dessert fruit <strong>for</strong> the export and domestic market, respectively.<br />
DMPI is canned as tropical fruit cocktail. Major markets <strong>for</strong> Solo papaya are Japan, with a<br />
comparative share of 74.10%, and Hongkong, with 21.46%. Other importers of Philippine fresh<br />
papaya are Taiwan (0.91%), Singapore (0.71%), New Zealand (0.68%), Saudi Arabia (0.68%),<br />
UAE (0.59%), South Korea (0.55%), China (0.18%), South Africa (0.10%), and others (0.05%).<br />
Production ranged from 85,000 mt to 100,000 mt from 1990–2003. The area harvested grew<br />
from 6,000 ha in 1990 to 9,000 ha in 2003. The yield increased minimally, from 14mt/ha in 1990<br />
to 15mt/ha in 2003 (Payot, 2005; DA–NAFC–Philippine Genetics, Inc., 2002; National Papaya<br />
R&D Committee, 2004). In general, papaya production, area harvested, and demand have been<br />
increasing. Yield, however, increased only minimally, while export has been continuing but is<br />
– 155 –