Business Potential for Agricultural Biotechnology - Asian Productivity ...
Business Potential for Agricultural Biotechnology - Asian Productivity ...
Business Potential for Agricultural Biotechnology - Asian Productivity ...

Create successful ePaper yourself
Turn your PDF publications into a flip-book with our unique Google optimized e-Paper software.
<strong>Business</strong> <strong>Potential</strong> <strong>for</strong> <strong>Agricultural</strong> <strong>Biotechnology</strong> Products<br />
2004, with continued growth in both white maize, used <strong>for</strong> food, and yellow maize, used <strong>for</strong> feed,<br />
as well as strong growth in biotech soybean, up from 35% adoption in 2003 to 50% in 2004,<br />
while Bt cotton has stabilized at about 85% adoption. Canada increased its combined area of<br />
biotech canola, maize, and soybean by 23%, to a total of 5.4 million ha, with 77% of its canola<br />
area planted to biotech varieties. The adoption of herbicide-tolerant soybeans in Argentina,<br />
which was close to 100% in 2003, continued to climb in 2004 as total plantings of soybean increased,<br />
which along with biotech maize and cotton reached an all-time high of 16.2 million ha<br />
of biotech crops. In the U.S., there was an estimated net gain of 11% of biotech crops in 2004 as<br />
a result of significant increases in the area of biotech maize, followed by biotech soybean, with<br />
modest growth in biotech cotton, which started to peak in the U.S. in 2004 as adoption<br />
approached 80%.<br />
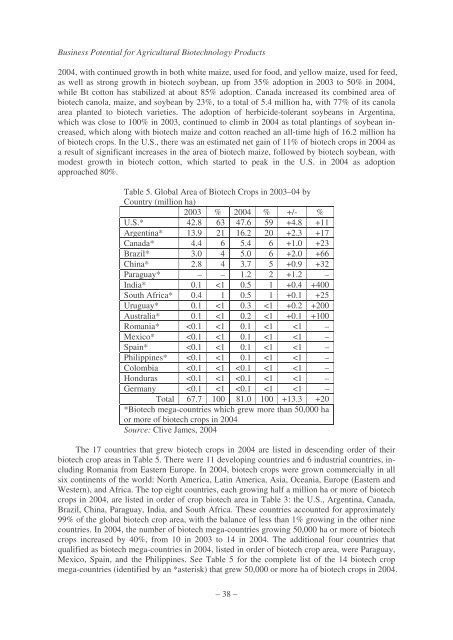
Table 5. Global Area of Biotech Crops in 2003–04 by<br />
Country (million ha)<br />
2003 % 2004 % +/- %<br />
U.S.* 42.8 63 47.6 59 +4.8 +11<br />
Argentina* 13.9 21 16.2 20 +2.3 +17<br />
Canada* 4.4 6 5.4 6 +1.0 +23<br />
Brazil* 3.0 4 5.0 6 +2.0 +66<br />
China* 2.8 4 3.7 5 +0.9 +32<br />
Paraguay* – – 1.2 2 +1.2 –<br />
India* 0.1