MEDICINSKI GLASNIK
MEDICINSKI GLASNIK
MEDICINSKI GLASNIK

Create successful ePaper yourself
Turn your PDF publications into a flip-book with our unique Google optimized e-Paper software.
hours the teeth were softened enough to pull the<br />
fillings out from their cavities with ease, just with<br />
a sharp excavator. The extracted fillings have<br />
thus become the specimen ready for observation.<br />
Leakage pattern was observed and measured<br />
through a dissecting microscope equipped with<br />
a digital camera (Olympus SZX-12 and Olympus<br />
DP-12, Olympus Optical Co.GmbH, Hamburg,<br />
Germany). Photographic images of the inner surface<br />
(tooth-faced) of the specimens were taken<br />
in three different positions, the different position<br />
meaning a one-third rotation (for 120 o ) in order<br />
to encompass the entire filling mantle (360 o ). The<br />
photographs were then transformed into computer<br />
images. A CAD (computer-aided design)<br />
computer program was used to observe the leakage<br />
pattern and to measure died surfaces.<br />
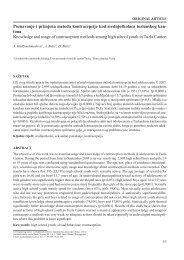
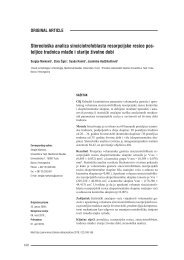
The first method of assessment was to measure<br />
the maximum depth point of leakage, and ordinal<br />
rating scores or levels - ranging from 0 to<br />
3 - were attributed to the marginal dye leakage.<br />
The ordinal rating scores are defined as follows<br />
(Figure 1):<br />
Figure 1. The scheme of a specimen with marked levels (in<br />
order to measure the point of leakage) (P. Simeon, 2005.)<br />
score 0 – no leakage; score I – leakage deep<br />
up to 1/3 of internal surface (up to 0.71 mm);<br />
score II – leakage deep up to 2/3 of internal surface<br />
(up to 1.42 mm); score III – leakage deep<br />
through entire lateral surface and filling’s bottom<br />
(up to 2.14 mm).<br />
Simeon et al Three-dimensional evaluation of microleakage<br />
The second method of leakage evaluation was<br />
to measure the inner surface of the filling colored<br />
with the contrast dye on three different surfaces of<br />
each specimen. The colored surface was measured<br />
in mm² and the total inner surface of (specimen’s)<br />
filling’s mantle was totaling 15.1 mm².<br />
For the statistical analysis of the depth of<br />
microleakage the highest (maximal) result measured<br />
in one specimen was used. For the analysis<br />
of surface of microleakage the sum of the leaked<br />
area from all three differently angled images was<br />
calculated. As a post-hoc test Kruskal-Wallis<br />
with Mann-Whitney U tests were used.<br />
RESULTS<br />
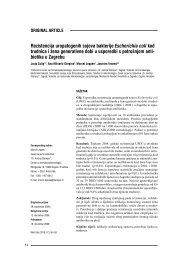
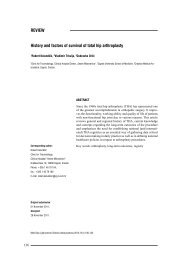
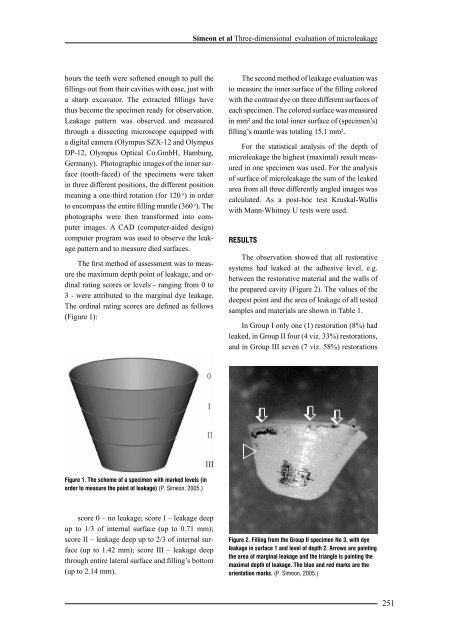
The observation showed that all restorative<br />
systems had leaked at the adhesive level, e.g.<br />
between the restorative material and the walls of<br />
the prepared cavity (Figure 2). The values of the<br />
deepest point and the area of leakage of all tested<br />
samples and materials are shown in Table 1.<br />
In Group I only one (1) restoration (8%) had<br />
leaked, in Group II four (4 viz. 33%) restorations,<br />
and in Group III seven (7 viz. 58%) restorations<br />
Figure 2. Filling from the Group II specimen No 3, with dye<br />
leakage in surface 1 and level of depth 2. Arrows are pointing<br />
the area of marginal leakage and the triangle is pointing the<br />
maximal depth of leakage. The blue and red marks are the<br />
orientation marks. (P. Simeon, 2005.)<br />
251