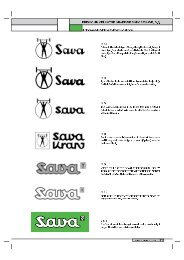
Annual report 2005 - Sava dd
Annual report 2005 - Sava dd
Annual report 2005 - Sava dd

You also want an ePaper? Increase the reach of your titles
YUMPU automatically turns print PDFs into web optimized ePapers that Google loves.
| consolidated financial statements in accordance with IFRS |<br />
CASH FLOWS IN INVESTING ACTIVITIES<br />
1 4 5 |<br />
(SIT in thousands)<br />
<strong>2005</strong> 2004<br />
Purchase of property, plant and equipment equipment -9,018,105 -8,890,167<br />
Proceeds from sale of property, plant and equipment equipment 2,523,162 2,218,157<br />
Purchase of intangible assets -85,400 -126,878<br />
Proceeds from sale of intangible assets 17,538 0<br />
Purchase of investment properties -1,491,865 -110,449<br />
Proceeds from sale of investment properties 403,209 381,280<br />
Purchase of subsidiaries -293,685 -11,970,898<br />
Proceeds from sale of subsidiaries 0 3,729,463<br />
Purchase of associates -133,920 -3,526,367<br />
Proceeds from sale of current financial investments 0 10,072,804<br />
Proceeds from repaid loans 468,050 0<br />
Expenses for granted loans 0 -149,498<br />
Purchase of equity securities available for sale -11,858,738 -12,307,750<br />
Proceeds from sale of non-current securities 10,056,744 6,438,586<br />
Received dividends of associates 1,361,350 552,960<br />
Other dividends received 492,590 97,613<br />
Received interests 339,526 262,396<br />
Net cash flow from investment activities -7,219,544 -13,328,748<br />
CASH FLOWS IN FINANCING ACTIVITIES<br />
Increase in share capital 0 8,008,000<br />
Other increase in equity -97,013 0<br />
Proceeds from granted non-current loans 7,117,350 4,856,420<br />
Expenditures for granted non-current loans -1,686,722 -1,065,506<br />
Proceeds from granted current loans 16,425,408 12,071,922<br />
Expenses for granted current loans -11,568,636 -11,065,350<br />
Expenses for dividends of Group's shareholders -1,242,294 -1,160,348<br />
Paid interests -1,462,950 -1,554,648<br />
Net cash flow from financing activities 7,485,143 10,090,490<br />
Net increase or decrease in cash and cash equivalents 1,855,689 -2,255,397<br />
Cash and cash equivalents at year begin 713,168 2,968,565<br />
Cash and cash equivalents at year end 2,568,857 713,168