Annual report 2005 - Sava dd
Annual report 2005 - Sava dd
Annual report 2005 - Sava dd

You also want an ePaper? Increase the reach of your titles
YUMPU automatically turns print PDFs into web optimized ePapers that Google loves.
a n n u a l r e p o r t | 2 0 0 5<br />
16.<br />
16.1<br />
9 6 |<br />
Business Operations of <strong>Sava</strong> d.d.<br />
The holding company <strong>Sava</strong> d.d. is the parent company of the <strong>Sava</strong> Group. Last year its business was successful<br />
and the results surpassed those planned. It created net sales revenues of €8.0 million, which was 5 per cent<br />
better than in the previous year. Financial income in the amount of €28.0 million is at last year’s level, while<br />
the planned pre-tax profit is exceeded by 40 per cent. Last year pre-tax profit totalled €21.5 million. The net<br />
profit of <strong>Sava</strong> d.d. in the amount of €17.9 million considerably surpasses that planned too; it is 39 per cent<br />
higher than last year and 26 per cent above plan, respectively.<br />
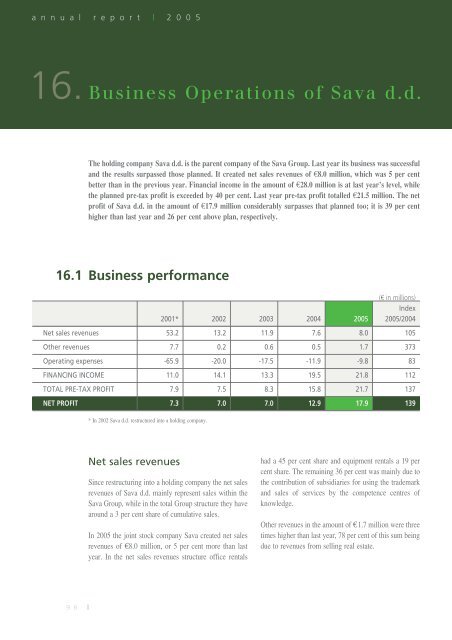
Business performance<br />
(€ in millions)<br />
Index<br />
2001* 2002 2003 2004 <strong>2005</strong> <strong>2005</strong>/2004<br />
Net sales revenues 53.2 13.2 11.9 7.6 8.0 105<br />
Other revenues 7.7 0.2 0.6 0.5 1.7 373<br />
Operating expenses -65.9 -20.0 -17.5 -11.9 -9.8 83<br />
FINANCING INCOME 11.0 14.1 13.3 19.5 21.8 112<br />
TOTAL PRE-TAX PROFIT 7.9 7.5 8.3 15.8 21.7 137<br />
NET PROFIT 7.3 7.0 7.0 12.9 17.9 139<br />
* In 2002 <strong>Sava</strong> d.d. restructured into a holding company.<br />
Net sales revenues<br />
Since restructuring into a holding company the net sales<br />
revenues of <strong>Sava</strong> d.d. mainly represent sales within the<br />
<strong>Sava</strong> Group, while in the total Group structure they have<br />
arounda3percentshareofcumulative sales.<br />
In <strong>2005</strong> the joint stock company <strong>Sava</strong> created net sales<br />
revenues of €8.0 million, or 5 per cent more than last<br />
year. In the net sales revenues structure office rentals<br />
had a 45 per cent share and equipment rentals a 19 per<br />
cent share. The remaining 36 per cent was mainly due to<br />
the contribution of subsidiaries for using the trademark<br />
and sales of services by the competence centres of<br />
knowledge.<br />
Other revenues in the amount of €1.7 million were three<br />
times higher than last year, 78 per cent of this sum being<br />
due to revenues from selling real estate.