Annual report 2005 - Sava dd
Annual report 2005 - Sava dd
Annual report 2005 - Sava dd

You also want an ePaper? Increase the reach of your titles
YUMPU automatically turns print PDFs into web optimized ePapers that Google loves.
a n n u a l r e p o r t | 2 0 0 5<br />
11.2<br />
5 0 |<br />
Ownership structure of<br />
the company<br />
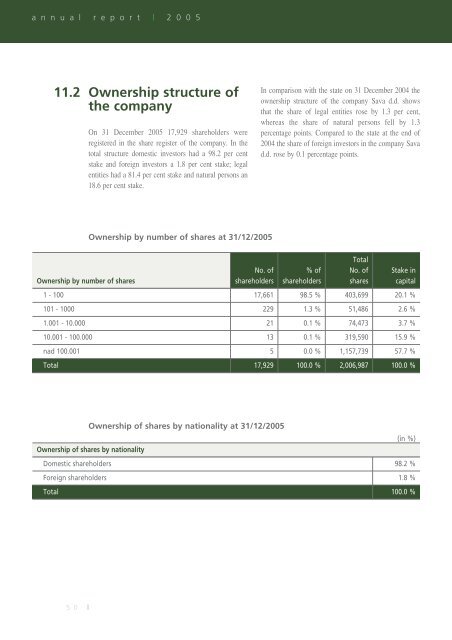
On 31 December <strong>2005</strong> 17,929 shareholders were<br />
registered in the share register of the company. In the<br />
total structure domestic investors had a 98.2 per cent<br />
stake and foreign investors a 1.8 per cent stake; legal<br />
entities had a 81.4 per cent stake and natural persons an<br />
18.6 per cent stake.<br />
In comparison with the state on 31 December 2004 the<br />
ownership structure of the company <strong>Sava</strong> d.d. shows<br />
that the share of legal entities rose by 1.3 per cent,<br />
whereas the share of natural persons fell by 1.3<br />
percentage points. Compared to the state at the end of<br />
2004 the share of foreign investors in the company <strong>Sava</strong><br />
d.d. rose by 0.1 percentage points.<br />
Ownership by number of shares at 31/12/<strong>2005</strong><br />
(v 000 SIT)<br />
No. of % of<br />
Total<br />
No. of Stake in<br />
Ownership by number of shares shareholders shareholders shares capital<br />
1 - 100 17,661 98.5 % 403,699 20.1 %<br />
101 - 1000 229 1.3 % 51,486 2.6 %<br />
1.001 - 10.000 21 0.1 % 74,473 3.7 %<br />
10.001 - 100.000 13 0.1 % 319,590 15.9 %<br />
nad 100.001 5 0.0 % 1,157,739 57.7 %<br />
Total 17,929 100.0 % 2,006,987 100.0 %<br />
Ownership of shares by nationality at 31/12/<strong>2005</strong><br />
Ownership of shares by nationality<br />
Domestic shareholders 98.2 %<br />
Foreign shareholders 1.8 %<br />
Total 100.0 %<br />
(in %)