Annual report 2005 - Sava dd
Annual report 2005 - Sava dd
Annual report 2005 - Sava dd

You also want an ePaper? Increase the reach of your titles
YUMPU automatically turns print PDFs into web optimized ePapers that Google loves.
a n n u a l r e p o r t | 2 0 0 5<br />
14. Business Operations<br />
of the <strong>Sava</strong> Group<br />
14.1<br />
6 2 |<br />
The consolidated financial statements of the <strong>Sava</strong> Group have been compiled according to International<br />
Financial Reporting Standards for the first time. The introduction of International Financial Reporting<br />
Standards has provided a more realistic presentation of the results and assets of the <strong>Sava</strong> Group. The items in<br />
the financial statements are valued at fair values as required by the new standards. The introduction of new<br />
standards has a positive effect on the presented return on capital employed of the <strong>Sava</strong> Group, which in <strong>2005</strong><br />
exceeded 10 per cent, as set in the strategy until 2007. The equity of the <strong>Sava</strong> Group as presented in the balance<br />
sheet increased too and amounted to more than €393 million or €193.8 per a share. Regardless of the applied<br />
standards, the <strong>Sava</strong> Group operated successfully and all key performance indicators surpassed the planned<br />
values. The <strong>Sava</strong> Group created a pre-tax profit of €43.8 million, which is 14.5 per cent higher than planned.<br />
In <strong>2005</strong> the companies in the <strong>Sava</strong> Group generated a net profit of €38.5 million, which was 4.3 per cent more<br />
than set in the business plan.<br />
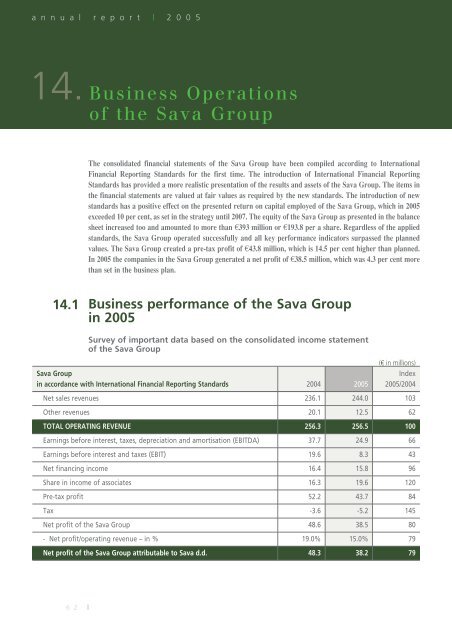
Business performance of the <strong>Sava</strong> Group<br />
in <strong>2005</strong><br />
Survey of important data based on the consolidated income statement<br />
of the <strong>Sava</strong> Group<br />
(€ in millions)<br />
<strong>Sava</strong> Group Index<br />
in accordance with International Financial Reporting Standards 2004 <strong>2005</strong> <strong>2005</strong>/2004<br />
Net sales revenues 236.1 244.0 103<br />
Other revenues 20.1 12.5 62<br />
TOTAL OPERATING REVENUE 256.3 256.5 100<br />
Earnings before interest, taxes, depreciation and amortisation (EBITDA) 37.7 24.9 66<br />
Earnings before interest and taxes (EBIT) 19.6 8.3 43<br />
Net financing income 16.4 15.8 96<br />
Share in income of associates 16.3 19.6 120<br />
Pre-tax profit 52.2 43.7 84<br />
Tax -3.6 -5.2 145<br />
Net profit of the <strong>Sava</strong> Group 48.6 38.5 80<br />
- Net profit/operating revenue – in % 19.0% 15.0% 79<br />
Net profit of the <strong>Sava</strong> Group attributable to <strong>Sava</strong> d.d. 48.3 38.2 79