Propriétés mécaniques et durée de vie de bétons réfractaires
Propriétés mécaniques et durée de vie de bétons réfractaires
Propriétés mécaniques et durée de vie de bétons réfractaires

You also want an ePaper? Increase the reach of your titles
YUMPU automatically turns print PDFs into web optimized ePapers that Google loves.
Tableau 10: Différents paramètres étudiés en fatigue cyclique sur le béton A<br />
Charge Moyenne (N) Amplitu<strong>de</strong> (N)<br />
2000 3000<br />
2500<br />
3000<br />
3000<br />
4000<br />
5000<br />
3000<br />
3500 4000<br />
4000<br />
3000<br />
2500<br />
4500 2000<br />
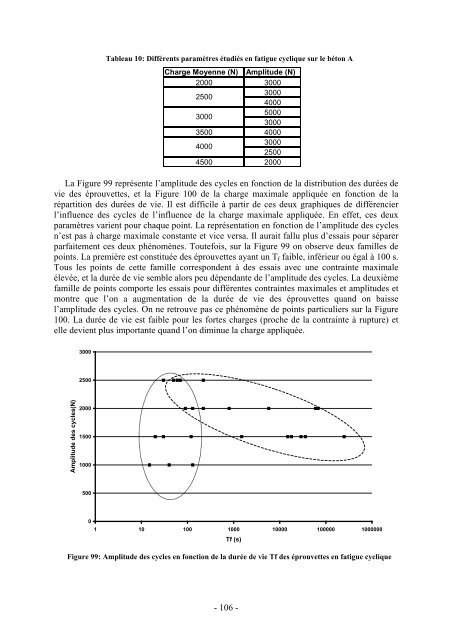
La Figure 99 représente l’amplitu<strong>de</strong> <strong>de</strong>s cycles en fonction <strong>de</strong> la distribution <strong>de</strong>s <strong>durée</strong>s <strong>de</strong><br />
<strong>vie</strong> <strong>de</strong>s éprouv<strong>et</strong>tes, <strong>et</strong> la Figure 100 <strong>de</strong> la charge maximale appliquée en fonction <strong>de</strong> la<br />
répartition <strong>de</strong>s <strong>durée</strong>s <strong>de</strong> <strong>vie</strong>. Il est difficile à partir <strong>de</strong> ces <strong>de</strong>ux graphiques <strong>de</strong> différencier<br />
l’influence <strong>de</strong>s cycles <strong>de</strong> l’influence <strong>de</strong> la charge maximale appliquée. En eff<strong>et</strong>, ces <strong>de</strong>ux<br />
paramètres varient pour chaque point. La représentation en fonction <strong>de</strong> l’amplitu<strong>de</strong> <strong>de</strong>s cycles<br />
n’est pas à charge maximale constante <strong>et</strong> vice versa. Il aurait fallu plus d’essais pour séparer<br />
parfaitement ces <strong>de</strong>ux phénomènes. Toutefois, sur la Figure 99 on observe <strong>de</strong>ux familles <strong>de</strong><br />
points. La première est constituée <strong>de</strong>s éprouv<strong>et</strong>tes ayant un T f faible, inférieur ou égal à 100 s.<br />
Tous les points <strong>de</strong> c<strong>et</strong>te famille correspon<strong>de</strong>nt à <strong>de</strong>s essais avec une contrainte maximale<br />
élevée, <strong>et</strong> la <strong>durée</strong> <strong>de</strong> <strong>vie</strong> semble alors peu dépendante <strong>de</strong> l’amplitu<strong>de</strong> <strong>de</strong>s cycles. La <strong>de</strong>uxième<br />
famille <strong>de</strong> points comporte les essais pour différentes contraintes maximales <strong>et</strong> amplitu<strong>de</strong>s <strong>et</strong><br />
montre que l’on a augmentation <strong>de</strong> la <strong>durée</strong> <strong>de</strong> <strong>vie</strong> <strong>de</strong>s éprouv<strong>et</strong>tes quand on baisse<br />
l’amplitu<strong>de</strong> <strong>de</strong>s cycles. On ne r<strong>et</strong>rouve pas ce phénomène <strong>de</strong> points particuliers sur la Figure<br />
100. La <strong>durée</strong> <strong>de</strong> <strong>vie</strong> est faible pour les fortes charges (proche <strong>de</strong> la contrainte à rupture) <strong>et</strong><br />
elle <strong>de</strong><strong>vie</strong>nt plus importante quand l’on diminue la charge appliquée.<br />
3000<br />
2500<br />
Amplitu<strong>de</strong> <strong>de</strong>s cycles(N)<br />
2000<br />
1500<br />
1000<br />
500<br />
0<br />
1 10 100 1000 10000 100000 1000000<br />
Tf (s)<br />
Figure 99: Amplitu<strong>de</strong> <strong>de</strong>s cycles en fonction <strong>de</strong> la <strong>durée</strong> <strong>de</strong> <strong>vie</strong> Tf <strong>de</strong>s éprouv<strong>et</strong>tes en fatigue cyclique<br />
- 106 -