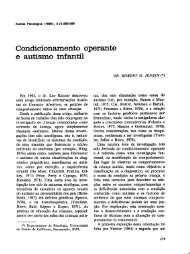
CEASCAAFARCAIAEAC GDTBBDEDRCCE AS CA AF AR C AI AE AC G DT B BD EDRCPearson Correlation 1 ,084 ,046 ,451 ** ,230 * ,469 ** ,140 ,520 ** ,565 ** -,363 ** -,238 * -,274 * -,346 **Sig. (2-tailed) ,458 ,688 ,000 ,040 ,000 ,217 ,000 ,000 ,001 ,033 ,014 ,002N 80 80 80 79 80 80 79 80 80 80 80 80 80Pearson Correlation ,084 1 ,433 ** ,421 ** ,457 ** -,098 ,266 * ,414 ** ,646 ** -,335 ** -,143 -,335 ** -,349 **Sig. (2-tailed) ,458 ,000 ,000 ,000 ,387 ,018 ,000 ,000 ,002 ,205 ,002 ,002N 80 80 80 79 80 80 79 80 80 80 80 80 80Pearson Correlation ,046 ,433 ** 1 ,313 ** ,352 ** -,145 ,118 ,353 ** ,538 ** -,336 ** -,368 ** -,507 ** -,470 **Sig. (2-tailed) ,688 ,000 ,005 ,001 ,198 ,300 ,001 ,000 ,002 ,001 ,000 ,000N 80 80 80 79 80 80 79 80 80 80 80 80 80Pearson Correlation ,451 ** ,421 ** ,313 ** 1 ,406 ** ,169 ,275 * ,721 ** ,782 ** -,605 ** -,367 ** -,656 ** -,648 **Sig. (2-tailed) ,000 ,000 ,005 ,000 ,137 ,015 ,000 ,000 ,000 ,001 ,000 ,000N 79 79 79 79 79 79 78 79 79 79 79 79 79Pearson Correlation ,230 * ,457 ** ,352 ** ,406 ** 1 ,076 ,062 ,459 ** ,633 ** -,338 ** -,140 -,324 ** -,332 **Sig. (2-tailed) ,040 ,000 ,001 ,000 ,501 ,585 ,000 ,000 ,002 ,214 ,003 ,003N 80 80 80 79 80 80 79 80 80 80 80 80 80Pearson Correlation ,469 ** -,098 -,145 ,169 ,076 1 ,112 ,330 ** ,346 ** -,073 -,025 ,004 -,043Sig. (2-tailed) ,000 ,387 ,198 ,137 ,501 ,325 ,003 ,002 ,521 ,828 ,971 ,702N 80 80 80 79 80 80 79 80 80 80 80 80 80Pearson Correlation ,140 ,266 * ,118 ,275 * ,062 ,112 1 ,251 * ,511 ** -,253 * -,065 -,209 -,236 *Sig. (2-tailed) ,217 ,018 ,300 ,015 ,585 ,325 ,026 ,000 ,024 ,568 ,065 ,036N 79 79 79 78 79 79 79 79 79 79 79 79 79Pearson Correlation ,520 ** ,414 ** ,353 ** ,721 ** ,459 ** ,330 ** ,251 * 1 ,762 ** -,630 ** -,476 ** -,640 ** -,693 **Sig. (2-tailed) ,000 ,000 ,001 ,000 ,000 ,003 ,026 ,000 ,000 ,000 ,000 ,000N 80 80 80 79 80 80 79 80 80 80 80 80 80Pearson Correlation ,565 ** ,646 ** ,538 ** ,782 ** ,633 ** ,346 ** ,511 ** ,762 ** 1 -,583 ** -,347 ** -,593 ** -,619 **Sig. (2-tailed) ,000 ,000 ,000 ,000 ,000 ,002 ,000 ,000 ,000 ,002 ,000 ,000N 80 80 80 79 80 80 79 80 80 80 80 80 80Pearson Correlation -,363 ** -,335 ** -,336 ** -,605 ** -,338 ** -,073 -,253 * -,630 ** -,583** 1 ,520 ** ,743 ** ,918 **Sig. (2-tailed) ,001 ,002 ,002 ,000 ,002 ,521 ,024 ,000 ,000 ,000 ,000 ,000N 80 80 80 79 80 80 79 80 80 80 80 80 80Pearson Correlation -,238 * -,143 -,368 ** -,367 ** -,140 -,025 -,065-,476 ** -,347** ,520 ** 1 ,473 ** ,696 **Sig. (2-tailed) ,033 ,205 ,001 ,001 ,214 ,828 ,568 ,000 ,002 ,000 ,000 ,000N 80 80 80 79 80 80 79 80 80 80 80 80 80Pearson Correlation -,274 * -,335 ** -,507 ** -,656 ** -,324 ** ,004 -,209-,640 ** -,593** ,743 ** ,473 ** 1 ,903 **Sig. (2-tailed) ,014 ,002 ,000 ,000 ,003 ,971 ,065 ,000 ,000 ,000 ,000 ,000N 80 80 80 79 80 80 79 80 80 80 80 80 80Pearson Correlation -,346 ** -,349 ** -,470 ** -,648 ** -,332 ** -,043 -,236 * -,693 ** -,619** ,918 ** ,696 ** ,903 ** 1Sig. (2-tailed) ,002 ,002 ,000 ,000 ,003 ,702 ,036 ,000 ,000 ,000 ,000 ,000N 80 80 80 79 80 80 79 80 80 80 80 80 80Sig. (2-tailed) ,002 ,033 ,114 ,000 ,000 ,006 ,190 ,000 ,000 ,001 ,000 ,000 ,000N 80 80 80 79 80 80 79 80 80 80 80 80 80CorrelationsDT B BD EDRC sc<strong>as</strong>T SA SP OC PA PIF GAPearson Correlation 1 ,520 ** ,743 ** ,918 ** ,294 ** ,111 ,424 ** ,139 ,216 ,201 ,191DT Sig. (2-tailed) ,000 ,000 ,000 ,008 ,329 ,000 ,218 ,054 ,074 ,089N 80 80 80 80 80 80 80 80 80 80 80Pearson Correlation ,520 ** 1 ,473 ** ,696 ** ,345 ** ,144 ,512 ** ,268 * ,250 * ,053 ,285 *B Sig. (2-tailed) ,000 ,000 ,000 ,002 ,201 ,000 ,016 ,025 ,641 ,011N 80 80 80 80 80 80 80 80 80 80 80Pearson Correlation ,743 ** ,473 ** 1 ,903 ** ,364 ** ,268 * ,274 * ,183 ,338 ** ,304 ** ,245 *BD Sig. (2-tailed) ,000 ,000 ,000 ,001 ,016 ,014 ,104 ,002 ,006 ,028N 80 80 80 80 80 80 80 80 80 80 80Pearson Correlation ,918 ** ,696 ** ,903 ** 1 ,384 ** ,214 ,433 ** ,219 ,315 ** ,237 * ,270 *EDRC Sig. (2-tailed) ,000 ,000 ,000 ,000 ,056 ,000 ,051 ,004 ,034 ,016N 80 80 80 80 80 80 80 80 80 80 80Pearson Correlation ,294 ** ,345 ** ,364 ** ,384 ** 1 ,725 ** ,622 ** ,724 ** ,826 ** ,692 ** ,839 **sc<strong>as</strong>T Sig. (2-tailed) ,008 ,002 ,001 ,000 ,000 ,000 ,000 ,000 ,000 ,000N 80 80 80 80 80 80 80 80 80 80 80Pearson Correlation ,111 ,144 ,268 * ,214 ,725 ** 1 ,233 * ,523 ** ,541 ** ,497 ** ,493 **SA Sig. (2-tailed) ,329 ,201 ,016 ,056 ,000 ,038 ,000 ,000 ,000 ,000N 80 80 80 80 80 80 80 80 80 80 80Pearson Correlation ,424 ** ,512 ** ,274 * ,433 ** ,622 ** ,233 * 1 ,333 ** ,353 ** ,298 ** ,528 **SP Sig. (2-tailed) ,000 ,000 ,014 ,000 ,000 ,038 ,003 ,001 ,007 ,000N 80 80 80 80 80 80 80 80 80 80 80Pearson Correlation ,139 ,268 * ,183 ,219 ,724 ** ,523 ** ,333 ** 1 ,510 ** ,439 ** ,553 **OC Sig. (2-tailed) ,218 ,016 ,104 ,051 ,000 ,000 ,003 ,000 ,000 ,000N 80 80 80 80 80 80 80 80 80 80 80Pearson Correlation ,216 ,250 * ,338 ** ,315 ** ,826 ** ,541 ** ,353 ** ,510 ** 1 ,453 ** ,650 **PA Sig. (2-tailed) ,054 ,025 ,002 ,004 ,000 ,000 ,001 ,000 ,000 ,000N 80 80 80 80 80 80 80 80 80 80 80Pearson Correlation ,201 ,053 ,304 ** ,237 * ,692 ** ,497 ** ,298 ** ,439 ** ,453 ** 1 ,483 **PIF Sig. (2-tailed) ,074 ,641 ,006 ,034 ,000 ,000 ,007 ,000 ,000 ,000N 80 80 80 80 80 80 80 80 80 80 80Pearson Correlation ,191 ,285 * ,245 * ,270 * ,839 ** ,493 ** ,528 ** ,553 ** ,650 ** ,483 ** 1GA Sig. (2-tailed) ,089 ,011 ,028 ,016 ,000 ,000 ,000 ,000 ,000 ,000N 80 80 80 80 80 80 80 80 80 80 80**. Correlation is significant at the 0.01 level (2-tailed).*. Correlation is significant at the 0.05 level (2-tailed).99
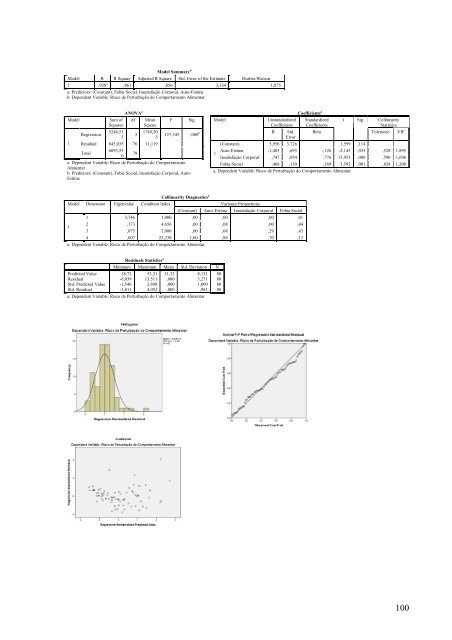
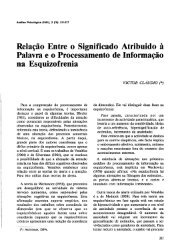
Model Summary bModel R R Square Adjusted R Square Std. Error of the Estimate Durbin-Watson1 ,928 a ,861 ,856 3,334 1,875a. Predictors: (Constant), Fobia Social, Insatisfação Corporal, Auto-Estimab. Dependent Variable: Risco de Perturbação <strong>do</strong> Comportamento AlimentarModelRegressionSum ofSquares5248,515ANOVA adf3MeanSquare1749,505FSig.157,345 ,000 b1 Residual 845,035 76 11,119Total6093,55079a. Dependent Variable: Risco de Perturbação <strong>do</strong> ComportamentoAlimentarb. Predictors: (Constant), Fobia Social, Insatisfação Corporal, Auto-EstimaModelUnstandardizedCoefficientsB Std.ErrorCoefficients aStandardizedCoefficientsBetatSig.CollinearityStatisticsTolerance VIF(Constant) 5,956 3,726 1,599 ,114Auto-Estima1-1,485 ,693 -,126 -2,145 ,035 ,528 1,895Insatisfação Corporal ,747 ,054 ,776 13,953 ,000 ,590 1,696Fobia Social ,468 ,130 ,169 3,592 ,001 ,828 1,208a. Dependent Variable: Risco de Perturbação <strong>do</strong> Comportamento AlimentarModel Dimension EigenvalueCollinearity Diagnostics aCondition IndexVariance Proportions(Constant) Auto-Estima Insatisfação Corporal Fobia Social1 3,746 1,000 ,00 ,00 ,00 ,0112 ,173 4,656 ,00 ,08 ,00 ,443 ,075 7,080 ,00 ,08 ,29 ,434 ,007 23,238 1,00 ,84 ,70 ,13a. Dependent Variable: Risco de Perturbação <strong>do</strong> Comportamento AlimentarResiduals Statistics aMinimum Maximum Mean Std. Deviation NPredicted Value 18,72 53,31 31,32 8,151 80Residual -6,039 13,511 ,000 3,271 80Std. Predicted Value -1,546 2,698 ,000 1,000 80Std. Residual -1,811 4,052 ,000 ,981 80a. Dependent Variable: Risco de Perturbação <strong>do</strong> Comportamento Alimentar100
- Page 1 and 2:
A RELAÇÃO ENTRE FACTORES PSICOLÓ
- Page 3:
AGRADECIMENTOSEm primeiro lugar, n
- Page 7 and 8:
LISTA DE TABELASTabela 1. Análise
- Page 9 and 10:
Neste sentido, face às intensas al
- Page 11 and 12:
2. MÉTODO2.1. Delineamento de Inve
- Page 13 and 14:
Sozinho/a 5 6,3%Colégio 1 1,3%Esta
- Page 15 and 16:
Perturbação do Comportamento Alim
- Page 17 and 18:
nenhum diagnóstico de PCA, as nota
- Page 19 and 20:
2) Aceitação Social - AC (2. 10,
- Page 21 and 22:
entanto, segundo Spence (1997), é
- Page 23 and 24:
Para a análise das PCA, Insatisfa
- Page 25 and 26:
Quanto ao Sexo, verificaram-se dife
- Page 27 and 28:
Tabela 6. Distribuição da Compet
- Page 29 and 30:
Para a Raça, foram encontradas dif
- Page 31 and 32:
4. DISCUSSÃOO primeiro objectivo e
- Page 33 and 34:
vários estudos, segundo os quais,
- Page 35 and 36:
Observa-se também que o Autoconcei
- Page 37 and 38:
Perturbações de Ansiedade General
- Page 39 and 40:
poderão estar relacionados com o f
- Page 41 and 42:
6. REFERÊNCIAS BIBLIOGRÁFICASAssu
- Page 43 and 44:
Croll, J. (2005). Body Image and Ad
- Page 45 and 46:
Lewis-Fernandez, R., Hinton, D., La
- Page 47 and 48:
Shaw, H., Ramirez, J., Trost, A., R
- Page 49 and 50:
ANEXO A“Revisão de Conceitos”C
- Page 51 and 52:
Associadas às mudanças pubertári
- Page 53 and 54:
De acordo com a perspectiva de Erik
- Page 55 and 56: modificada por factores pessoais (e
- Page 57 and 58: CAPÍTULO III - PERTURBAÇÕES DO C
- Page 59 and 60: Perturbações do Comportamento Ali
- Page 61 and 62: Outro aspecto que parece estar rela
- Page 63 and 64: atribuído pela pessoa a essa mesma
- Page 65 and 66: categorias; 2) é multidimensional,
- Page 67 and 68: comportamentais. Por outro lado, o
- Page 69 and 70: A ansiedade patológica pode ser re
- Page 71 and 72: de perder o controlo ou de enlouque
- Page 73 and 74: ou tensão interior; 2) Fadiga fác
- Page 75 and 76: Candeias, M. (1999). A auto-represe
- Page 77 and 78: Grogan, S. (2008). Body Image: Unde
- Page 79 and 80: Russo, J., Brennan, L., Walkley, J.
- Page 81 and 82: ANEXO B“Consentimento Informado
- Page 83 and 84: II. Perceived Competence for Adoles
- Page 85 and 86: Exacta/ComoeuMais ouMenoscomoeuםם
- Page 87 and 88: III Inventário de Perturbação do
- Page 89 and 90: NuncaRaramenteÀs vezesComfrequênc
- Page 91 and 92: NuncaÀs VezesFrequentementeSempre1
- Page 93 and 94: Fiabilidade dos InstrumentosReliabi
- Page 95 and 96: ValidNíveis de Autoconceito Global
- Page 97 and 98: Estado CivílTests of NormalityKolm
- Page 99 and 100: Test Statistics aCE AS CA AR C AI A
- Page 101 and 102: CEASCAAFARCAIAETests of NormalityPr
- Page 103 and 104: scasT SA SP PA GAMann-Whitney U 361
- Page 105: Análise da Relação entre Imagem