SexoTests of NormalityKolmogorov-Smirnov a Shapiro-WilkStatistic df Sig. Statistic df Sig.CEFeminino ,138 62 ,005 ,972 62 ,166M<strong>as</strong>culino ,163 16 ,200 * ,925 16 ,205ASFeminino ,093 62 ,200 * ,978 62 ,328M<strong>as</strong>culino ,170 16 ,200 * ,935 16 ,289CAFeminino ,106 62 ,083 ,968 62 ,100M<strong>as</strong>culino ,157 16 ,200 * ,953 16 ,545AFFeminino ,101 62 ,186 ,938 62 ,004M<strong>as</strong>culino ,111 16 ,200 * ,961 16 ,685ARFeminino ,174 62 ,000 ,939 62 ,004M<strong>as</strong>culino ,222 16 ,034 ,903 16 ,090CFeminino ,128 62 ,013 ,913 62 ,000M<strong>as</strong>culino ,117 16 ,200 * ,966 16 ,764AIFeminino ,282 62 ,000 ,788 62 ,000M<strong>as</strong>culino ,268 16 ,003 ,777 16 ,001AEFeminino ,128 62 ,013 ,949 62 ,012M<strong>as</strong>culino ,285 16 ,001 ,859 16 ,019ACGFeminino ,074 62 ,200 * ,980 62 ,409M<strong>as</strong>culino ,098 16 ,200 * ,975 16 ,911*. This is a lower bound of the true significance.a. Lilliefors Significance CorrectionASCAAFACGGroup StatisticsSexo N Mean Std. Deviation Std. Error MeanFeminino 64 2,7094 ,70547 ,08818M<strong>as</strong>culino 16 3,1375 ,62703 ,15676Feminino 64 2,2281 ,69999 ,08750M<strong>as</strong>culino 16 2,8750 ,68848 ,17212Feminino 63 2,4825 ,95488 ,12030M<strong>as</strong>culino 16 2,6250 ,89703 ,22426Feminino 64 2,7718 ,42042 ,05255M<strong>as</strong>culino 16 2,9518 ,43653 ,10913CEARCAIAEASCAAFACGRanksSexo N Mean Rank Sum of RanksFeminino 64 39,50 2528,00M<strong>as</strong>culino 16 44,50 712,00Total 80Feminino 64 39,28 2514,00M<strong>as</strong>culino 16 45,38 726,00Total 80Feminino 64 42,67 2731,00M<strong>as</strong>culino 16 31,81 509,00Total 80Feminino 63 40,04 2522,50M<strong>as</strong>culino 16 39,84 637,50Total 79Feminino 64 38,98 2494,50M<strong>as</strong>culino 16 46,59 745,50Total 80Test Statistics aCE AR C AI AEMann-Whitney U 448,000 434,000 373,000 501,500 414,500Wilcoxon W 2528,000 2514,000 509,000 637,500 2494,500Z -,774 -,944 -1,683 -,033 -1,178Asymp. Sig. (2-tailed) ,439 ,345 ,092 ,974 ,239a. Grouping Variable: SexoIndependent Samples TestLevene's Test fort-test for Equality of MeansEquality of VariancesF Sig. t df Sig. (2- Mean Std. Error 95% Confidence Interval of the Differencetailed) Difference Difference Lower UpperEqual variances <strong>as</strong>sumed ,164 ,687 -2,216 78 ,030 -,42812 ,19316 -,81268 -,04357Equal variances not <strong>as</strong>sumed -2,380 25,391 ,025 -,42812 ,17986 -,79826 -,05799Equal variances <strong>as</strong>sumed ,082 ,775 -3,317 78 ,001 -,64688 ,19504 -1,03517 -,25858Equal variances not <strong>as</strong>sumed -3,350 23,383 ,003 -,64688 ,19308 -1,04594 -,24781Equal variances <strong>as</strong>sumed ,538 ,465 -,539 77 ,591 -,14246 ,26424 -,66863 ,38371Equal variances not <strong>as</strong>sumed -,560 24,387 ,581 -,14246 ,25449 -,66726 ,38234Equal variances <strong>as</strong>sumed ,001 ,980 -1,520 78 ,132 -,17999 ,11839 -,41568 ,05571Equal variances not <strong>as</strong>sumed -1,486 22,476 ,151 -,17999 ,12113 -,43088 ,07091RaçaTests of NormalityKolmogorov-Smirnov a Shapiro-WilkStatistic df Sig. Statistic df Sig.CENegra ,159 15 ,200 * ,945 15 ,450Cauc<strong>as</strong>iana ,143 61 ,004 ,968 61 ,114ASNegra ,141 15 ,200 * ,965 15 ,783Cauc<strong>as</strong>iana ,133 61 ,009 ,972 61 ,167CANegra ,180 15 ,200 * ,970 15 ,863Cauc<strong>as</strong>iana ,121 61 ,027 ,964 61 ,074AFNegra ,185 15 ,177 ,913 15 ,149Cauc<strong>as</strong>iana ,091 61 ,200 * ,947 61 ,010ARNegra ,190 15 ,151 ,940 15 ,377Cauc<strong>as</strong>iana ,161 61 ,000 ,933 61 ,002CNegra ,192 15 ,142 ,932 15 ,293Cauc<strong>as</strong>iana ,153 61 ,001 ,899 61 ,000AINegra ,190 15 ,152 ,897 15 ,085Cauc<strong>as</strong>iana ,302 61 ,000 ,747 61 ,000AENegra ,225 15 ,040 ,914 15 ,157Cauc<strong>as</strong>iana ,164 61 ,000 ,940 61 ,005ACGNegra ,116 15 ,200 * ,966 15 ,790Cauc<strong>as</strong>iana ,092 61 ,200 * ,980 61 ,405*. This is a lower bound of the true significance.a. Lilliefors Significance CorrectionCEASCAARCAIAERanksRaça N Mean Rank Sum of RanksNegra 15 34,50 517,50Cauc<strong>as</strong>iana 63 40,69 2563,50Total 78Negra 15 43,77 656,50Cauc<strong>as</strong>iana 63 38,48 2424,50Total 78Negra 15 37,00 555,00Cauc<strong>as</strong>iana 63 40,10 2526,00Total 78Negra 15 33,83 507,50Cauc<strong>as</strong>iana 63 40,85 2573,50Total 78Negra 15 26,43 396,50Cauc<strong>as</strong>iana 63 42,61 2684,50Total 78Negra 15 30,33 455,00Cauc<strong>as</strong>iana 62 41,10 2548,00Total 77Negra 15 32,13 482,00Cauc<strong>as</strong>iana 63 41,25 2599,00Total 7891
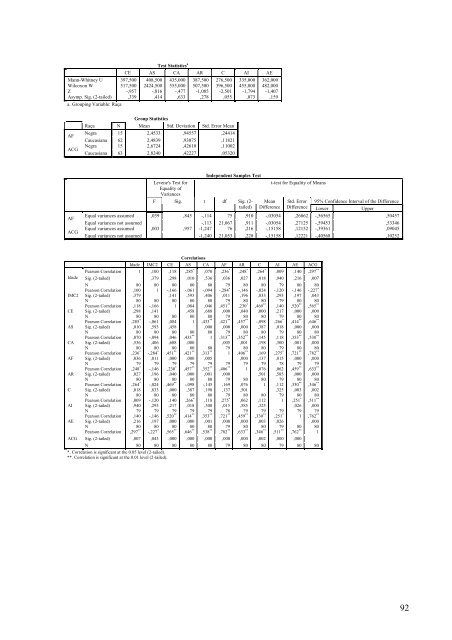
Test Statistics aCE AS CA AR C AI AEMann-Whitney U 397,500 408,500 435,000 387,500 276,500 335,000 362,000Wilcoxon W 517,500 2424,500 555,000 507,500 396,500 455,000 482,000Z -,957 -,816 -,477 -1,085 -2,501 -1,794 -1,407Asymp. Sig. (2-tailed) ,339 ,414 ,633 ,278 ,055 ,073 ,159a. Grouping Variable: RaçaAFACGGroup StatisticsRaça N Mean Std. Deviation Std. Error MeanNegra 15 2,4533 ,94557 ,24414Cauc<strong>as</strong>iana 62 2,4839 ,93075 ,11821Negra 15 2,6724 ,42610 ,11002Cauc<strong>as</strong>iana 63 2,8240 ,42227 ,05320AFACGIndependent Samples TestLevene's Test fort-test for Equality of MeansEquality ofVariancesF Sig. t df Sig. (2- Mean Std. Error 95% Confidence Interval of the Differencetailed) Difference Difference Lower UpperEqual variances <strong>as</strong>sumed ,039 ,845 -,114 75 ,910 -,03054 ,26862 -,56565 ,50457Equal variances not <strong>as</strong>sumed -,113 21,067 ,911 -,03054 ,27125 -,59453 ,53346Equal variances <strong>as</strong>sumed ,003 ,957 -1,247 76 ,216 -,15158 ,12152 -,39361 ,09045Equal variances not <strong>as</strong>sumed -1,240 21,053 ,228 -,15158 ,12221 -,40568 ,10252CorrelationsIdade IMC2 CE AS CA AF AR C AI AE ACGPearson Correlation 1 ,100 ,118 ,285 * ,070 ,236 * ,248 * ,264 * ,009 ,140 ,297 **Idade Sig. (2-tailed) ,379 ,298 ,010 ,536 ,036 ,027 ,018 ,940 ,216 ,007N 80 80 80 80 80 79 80 80 79 80 80Pearson Correlation ,100 1 -,166 -,061 -,094 -,284 * -,146 -,024 -,120 -,146 -,227 *IMC2 Sig. (2-tailed) ,379 ,141 ,593 ,406 ,011 ,196 ,833 ,293 ,197 ,043N 80 80 80 80 80 79 80 80 79 80 80Pearson Correlation ,118 -,166 1 ,084 ,046 ,451 ** ,230 * ,469 ** ,140 ,520 ** ,565 **CE Sig. (2-tailed) ,298 ,141 ,458 ,688 ,000 ,040 ,000 ,217 ,000 ,000N 80 80 80 80 80 79 80 80 79 80 80Pearson Correlation ,285 * -,061 ,084 1 ,433 ** ,421 ** ,457 ** -,098 ,266 * ,414 ** ,646 **AS Sig. (2-tailed) ,010 ,593 ,458 ,000 ,000 ,000 ,387 ,018 ,000 ,000N 80 80 80 80 80 79 80 80 79 80 80Pearson Correlation ,070 -,094 ,046 ,433 ** 1 ,313 ** ,352 ** -,145 ,118 ,353 ** ,538 **CA Sig. (2-tailed) ,536 ,406 ,688 ,000 ,005 ,001 ,198 ,300 ,001 ,000N 80 80 80 80 80 79 80 80 79 80 80Pearson Correlation ,236 * -,284 * ,451 ** ,421 ** ,313 ** 1 ,406 ** ,169 ,275 * ,721 ** ,782 **AF Sig. (2-tailed) ,036 ,011 ,000 ,000 ,005 ,000 ,137 ,015 ,000 ,000N 79 79 79 79 79 79 79 79 78 79 79Pearson Correlation ,248 * -,146 ,230 * ,457 ** ,352 ** ,406 ** 1 ,076 ,062 ,459 ** ,633 **AR Sig. (2-tailed) ,027 ,196 ,040 ,000 ,001 ,000 ,501 ,585 ,000 ,000N 80 80 80 80 80 79 80 80 79 80 80Pearson Correlation ,264 * -,024 ,469 ** -,098 -,145 ,169 ,076 1 ,112 ,330 ** ,346 **C Sig. (2-tailed) ,018 ,833 ,000 ,387 ,198 ,137 ,501 ,325 ,003 ,002N 80 80 80 80 80 79 80 80 79 80 80Pearson Correlation ,009 -,120 ,140 ,266 * ,118 ,275 * ,062 ,112 1 ,251 * ,511 **AI Sig. (2-tailed) ,940 ,293 ,217 ,018 ,300 ,015 ,585 ,325 ,026 ,000N 79 79 79 79 79 78 79 79 79 79 79Pearson Correlation ,140 -,146 ,520 ** ,414 ** ,353 ** ,721 ** ,459 ** ,330 ** ,251 * 1 ,762 **AE Sig. (2-tailed) ,216 ,197 ,000 ,000 ,001 ,000 ,000 ,003 ,026 ,000N 80 80 80 80 80 79 80 80 79 80 80Pearson Correlation ,297 ** -,227 * ,565 ** ,646 ** ,538 ** ,782 ** ,633 ** ,346 ** ,511 ** ,762 ** 1ACG Sig. (2-tailed) ,007 ,043 ,000 ,000 ,000 ,000 ,000 ,002 ,000 ,000N 80 80 80 80 80 79 80 80 79 80 80*. Correlation is significant at the 0.05 level (2-tailed).**. Correlation is significant at the 0.01 level (2-tailed).92
- Page 1 and 2:
A RELAÇÃO ENTRE FACTORES PSICOLÓ
- Page 3:
AGRADECIMENTOSEm primeiro lugar, n
- Page 7 and 8:
LISTA DE TABELASTabela 1. Análise
- Page 9 and 10:
Neste sentido, face às intensas al
- Page 11 and 12:
2. MÉTODO2.1. Delineamento de Inve
- Page 13 and 14:
Sozinho/a 5 6,3%Colégio 1 1,3%Esta
- Page 15 and 16:
Perturbação do Comportamento Alim
- Page 17 and 18:
nenhum diagnóstico de PCA, as nota
- Page 19 and 20:
2) Aceitação Social - AC (2. 10,
- Page 21 and 22:
entanto, segundo Spence (1997), é
- Page 23 and 24:
Para a análise das PCA, Insatisfa
- Page 25 and 26:
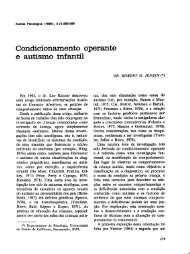
Quanto ao Sexo, verificaram-se dife
- Page 27 and 28:
Tabela 6. Distribuição da Compet
- Page 29 and 30:
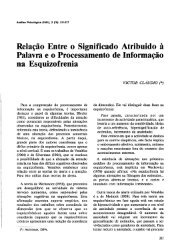
Para a Raça, foram encontradas dif
- Page 31 and 32:
4. DISCUSSÃOO primeiro objectivo e
- Page 33 and 34:
vários estudos, segundo os quais,
- Page 35 and 36:
Observa-se também que o Autoconcei
- Page 37 and 38:
Perturbações de Ansiedade General
- Page 39 and 40:
poderão estar relacionados com o f
- Page 41 and 42:
6. REFERÊNCIAS BIBLIOGRÁFICASAssu
- Page 43 and 44:
Croll, J. (2005). Body Image and Ad
- Page 45 and 46:
Lewis-Fernandez, R., Hinton, D., La
- Page 47 and 48: Shaw, H., Ramirez, J., Trost, A., R
- Page 49 and 50: ANEXO A“Revisão de Conceitos”C
- Page 51 and 52: Associadas às mudanças pubertári
- Page 53 and 54: De acordo com a perspectiva de Erik
- Page 55 and 56: modificada por factores pessoais (e
- Page 57 and 58: CAPÍTULO III - PERTURBAÇÕES DO C
- Page 59 and 60: Perturbações do Comportamento Ali
- Page 61 and 62: Outro aspecto que parece estar rela
- Page 63 and 64: atribuído pela pessoa a essa mesma
- Page 65 and 66: categorias; 2) é multidimensional,
- Page 67 and 68: comportamentais. Por outro lado, o
- Page 69 and 70: A ansiedade patológica pode ser re
- Page 71 and 72: de perder o controlo ou de enlouque
- Page 73 and 74: ou tensão interior; 2) Fadiga fác
- Page 75 and 76: Candeias, M. (1999). A auto-represe
- Page 77 and 78: Grogan, S. (2008). Body Image: Unde
- Page 79 and 80: Russo, J., Brennan, L., Walkley, J.
- Page 81 and 82: ANEXO B“Consentimento Informado
- Page 83 and 84: II. Perceived Competence for Adoles
- Page 85 and 86: Exacta/ComoeuMais ouMenoscomoeuםם
- Page 87 and 88: III Inventário de Perturbação do
- Page 89 and 90: NuncaRaramenteÀs vezesComfrequênc
- Page 91 and 92: NuncaÀs VezesFrequentementeSempre1
- Page 93 and 94: Fiabilidade dos InstrumentosReliabi
- Page 95 and 96: ValidNíveis de Autoconceito Global
- Page 97: Estado CivílTests of NormalityKolm
- Page 101 and 102: CEASCAAFARCAIAETests of NormalityPr
- Page 103 and 104: scasT SA SP PA GAMann-Whitney U 361
- Page 105 and 106: Análise da Relação entre Imagem
- Page 107: Model Summary bModel R R Square Adj