Integrated Transport Plan.pdf - Durban
Integrated Transport Plan.pdf - Durban
Integrated Transport Plan.pdf - Durban

You also want an ePaper? Increase the reach of your titles
YUMPU automatically turns print PDFs into web optimized ePapers that Google loves.
� Heavy Vehicles<br />
� Light Delivery Vehicles/Bakkies<br />
� Cars<br />
Apart from the type of vehicle involved the evaluation noted the age, sex<br />
and category of the person involved as being pedestrians, drivers and<br />
passengers.<br />
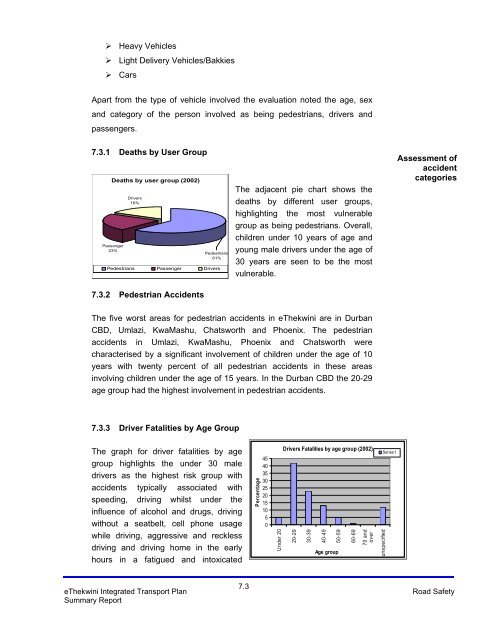
7.3.1 Deaths by User Group<br />
Deaths by user group (2002)<br />
Passenger<br />
23%<br />
Drivers<br />
16%<br />
7.3.2 Pedestrian Accidents<br />
Pedestrians<br />
61%<br />
Pedestrians Passenger Drivers<br />
The adjacent pie chart shows the<br />
deaths by different user groups,<br />
highlighting the most vulnerable<br />
group as being pedestrians. Overall,<br />
children under 10 years of age and<br />
young male drivers under the age of<br />
30 years are seen to be the most<br />
vulnerable.<br />
The five worst areas for pedestrian accidents in eThekwini are in <strong>Durban</strong><br />
CBD, Umlazi, KwaMashu, Chatsworth and Phoenix. The pedestrian<br />
accidents in Umlazi, KwaMashu, Phoenix and Chatsworth were<br />
characterised by a significant involvement of children under the age of 10<br />
years with twenty percent of all pedestrian accidents in these areas<br />
involving children under the age of 15 years. In the <strong>Durban</strong> CBD the 20-29<br />
age group had the highest involvement in pedestrian accidents.<br />
7.3.3 Driver Fatalities by Age Group<br />
The graph for driver fatalities by age<br />
group highlights the under 30 male<br />
drivers as the highest risk group with<br />
accidents typically associated with<br />
speeding, driving whilst under the<br />
influence of alcohol and drugs, driving<br />
without a seatbelt, cell phone usage<br />
while driving, aggressive and reckless<br />
driving and driving home in the early<br />
hours in a fatigued and intoxicated<br />
Percentage<br />
Drivers Fatalities by age group (2002)<br />
eThekwini <strong>Integrated</strong> <strong>Transport</strong> <strong>Plan</strong><br />
Summary Report<br />
7.3<br />
Road Safety<br />
45<br />
40<br />
35<br />
30<br />
25<br />
20<br />
15<br />
10<br />
5<br />
0<br />
U nder 20<br />
20-29<br />
30-39<br />
40-49<br />
50-59<br />
Age group<br />
60-69<br />
70 and<br />
over<br />
unspecified<br />
Series1<br />
Assessment of<br />
accident<br />
categories
![INK Environmental Sustainability Booklet [19 MB] - Durban](https://img.yumpu.com/22025104/1/190x136/ink-environmental-sustainability-booklet-19-mb-durban.jpg?quality=85)