

Download the report - The Healing Foundation
Download the report - The Healing Foundation
Download the report - The Healing Foundation

You also want an ePaper? Increase the reach of your titles
YUMPU automatically turns print PDFs into web optimized ePapers that Google loves.
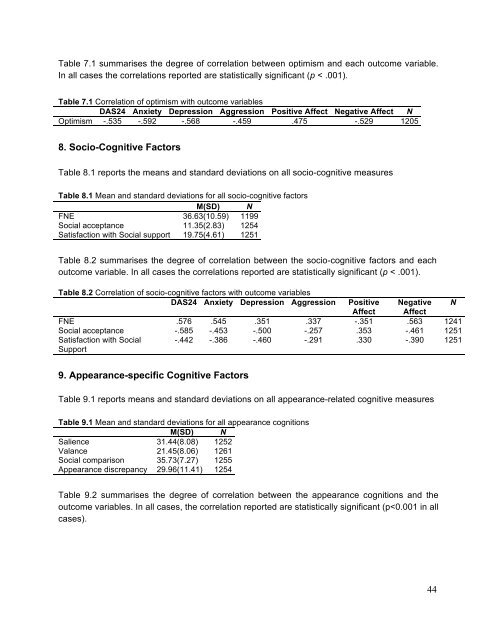
Table 7.1 summarises <strong>the</strong> degree of correlation between optimism and each outcome variable.<br />
In all cases <strong>the</strong> correlations <strong>report</strong>ed are statistically significant (p < .001).<br />
Table 7.1 Correlation of optimism with outcome variables<br />
DAS24 Anxiety Depression Aggression Positive Affect Negative Affect N<br />
Optimism -.535 -.592 -.568 -.459 .475 -.529 1205<br />
8. Socio-Cognitive Factors<br />
Table 8.1 <strong>report</strong>s <strong>the</strong> means and standard deviations on all socio-cognitive measures<br />
Table 8.1 Mean and standard deviations for all socio-cognitive factors<br />
M(SD) N<br />
FNE 36.63(10.59) 1199<br />
Social acceptance 11.35(2.83) 1254<br />
Satisfaction with Social support 19.75(4.61) 1251<br />
Table 8.2 summarises <strong>the</strong> degree of correlation between <strong>the</strong> socio-cognitive factors and each<br />
outcome variable. In all cases <strong>the</strong> correlations <strong>report</strong>ed are statistically significant (p < .001).<br />
Table 8.2 Correlation of socio-cognitive factors with outcome variables<br />
DAS24 Anxiety Depression Aggression Positive Negative N<br />
Affect Affect<br />
FNE .576 .545 .351 .337 -.351 .563 1241<br />
Social acceptance -.585 -.453 -.500 -.257 .353 -.461 1251<br />
Satisfaction with Social<br />
Support<br />
-.442 -.386 -.460 -.291 .330 -.390 1251<br />
9. Appearance-specific Cognitive Factors<br />
Table 9.1 <strong>report</strong>s means and standard deviations on all appearance-related cognitive measures<br />
Table 9.1 Mean and standard deviations for all appearance cognitions<br />
M(SD) N<br />
Salience 31.44(8.08) 1252<br />
Valance 21.45(8.06) 1261<br />
Social comparison 35.73(7.27) 1255<br />
Appearance discrepancy 29.96(11.41) 1254<br />
Table 9.2 summarises <strong>the</strong> degree of correlation between <strong>the</strong> appearance cognitions and <strong>the</strong><br />
outcome variables. In all cases, <strong>the</strong> correlation <strong>report</strong>ed are statistically significant (p