View/Open - ResearchSpace - University of KwaZulu-Natal
View/Open - ResearchSpace - University of KwaZulu-Natal
View/Open - ResearchSpace - University of KwaZulu-Natal
Create successful ePaper yourself
Turn your PDF publications into a flip-book with our unique Google optimized e-Paper software.
List <strong>of</strong> Figures<br />
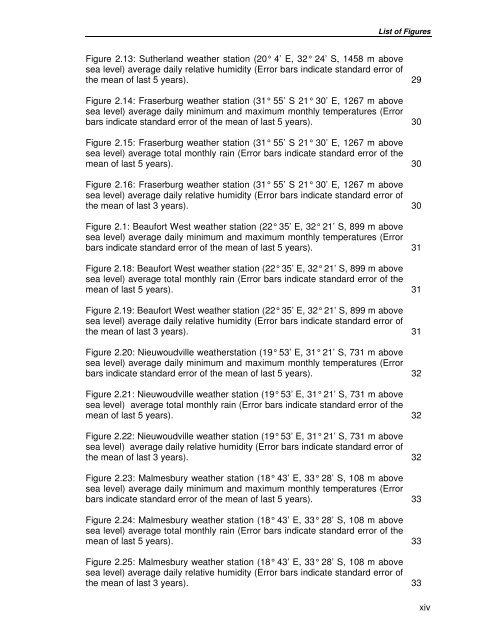
Figure 2.13: Sutherland weather station (20° 4’ E, 32° 24’ S, 1458 m above<br />
sea level) average daily relative humidity (Error bars indicate standard error <strong>of</strong><br />
the mean <strong>of</strong> last 5 years).<br />
Figure 2.14: Fraserburg weather station (31° 55’ S 21° 30’ E, 1267 m above<br />
sea level) average daily minimum and maximum monthly temperatures (Error<br />
bars indicate standard error <strong>of</strong> the mean <strong>of</strong> last 5 years).<br />
Figure 2.15: Fraserburg weather station (31° 55’ S 21° 30’ E, 1267 m above<br />
sea level) average total monthly rain (Error bars indicate standard error <strong>of</strong> the<br />
mean <strong>of</strong> last 5 years).<br />
Figure 2.16: Fraserburg weather station (31° 55’ S 21° 30’ E, 1267 m above<br />
sea level) average daily relative humidity (Error bars indicate standard error <strong>of</strong><br />
the mean <strong>of</strong> last 3 years).<br />
Figure 2.1: Beaufort West weather station (22° 35’ E, 32° 21’ S, 899 m above<br />
sea level) average daily minimum and maximum monthly temperatures (Error<br />
bars indicate standard error <strong>of</strong> the mean <strong>of</strong> last 5 years).<br />
Figure 2.18: Beaufort West weather station (22° 35’ E, 32° 21’ S, 899 m above<br />
sea level) average total monthly rain (Error bars indicate standard error <strong>of</strong> the<br />
mean <strong>of</strong> last 5 years).<br />
Figure 2.19: Beaufort West weather station (22° 35’ E, 32° 21’ S, 899 m above<br />
sea level) average daily relative humidity (Error bars indicate standard error <strong>of</strong><br />
the mean <strong>of</strong> last 3 years).<br />
Figure 2.20: Nieuwoudville weatherstation (19° 53’ E, 31° 21’ S, 731 m above<br />
sea level) average daily minimum and maximum monthly temperatures (Error<br />
bars indicate standard error <strong>of</strong> the mean <strong>of</strong> last 5 years).<br />
Figure 2.21: Nieuwoudville weather station (19° 53’ E, 31° 21’ S, 731 m above<br />
sea level) average total monthly rain (Error bars indicate standard error <strong>of</strong> the<br />
mean <strong>of</strong> last 5 years).<br />
Figure 2.22: Nieuwoudville weather station (19° 53’ E, 31° 21’ S, 731 m above<br />
sea level) average daily relative humidity (Error bars indicate standard error <strong>of</strong><br />
the mean <strong>of</strong> last 3 years).<br />
Figure 2.23: Malmesbury weather station (18° 43’ E, 33° 28’ S, 108 m above<br />
sea level) average daily minimum and maximum monthly temperatures (Error<br />
bars indicate standard error <strong>of</strong> the mean <strong>of</strong> last 5 years).<br />
Figure 2.24: Malmesbury weather station (18° 43’ E, 33° 28’ S, 108 m above<br />
sea level) average total monthly rain (Error bars indicate standard error <strong>of</strong> the<br />
mean <strong>of</strong> last 5 years).<br />
Figure 2.25: Malmesbury weather station (18° 43’ E, 33° 28’ S, 108 m above<br />
sea level) average daily relative humidity (Error bars indicate standard error <strong>of</strong><br />
the mean <strong>of</strong> last 3 years).<br />
29<br />
30<br />
30<br />
30<br />
31<br />
31<br />
31<br />
32<br />
32<br />
32<br />
33<br />
33<br />
33<br />
xiv


