- Page 1 and 2:
U L B bio mar UNIVERSITE LIBRE DE B
- Page 4 and 5:
Acknowledgements ACKNOWLEDGEMENTS W
- Page 6 and 7:
Abstract ABSTRACT A rearing protoco
- Page 8 and 9:
Résumé RESUME Un protocole d'éle
- Page 10 and 11:
Table of contents TABLE OF CONTENTS
- Page 12 and 13:
ANNEXES............................
- Page 14 and 15:
List of figures LIST OF FIGURES Fig
- Page 16 and 17:
List of figures Figure 28. A. Histo
- Page 18 and 19:
List of tables LIST OF TABLES Table
- Page 20 and 21:
List of equations LIST OF EQUATIONS
- Page 22 and 23:
List of equations Equation 33. Para
- Page 24 and 25:
List of symbols LIST OF SYMBOLS Var
- Page 26 and 27:
List of symbols IW Immersed weight:
- Page 28:
Introduction 27
- Page 31 and 32:
Foreword 30
- Page 33 and 34:
General introduction this study. Se
- Page 35 and 36:
General introduction intense fishin
- Page 37 and 38:
General introduction habitats: inte
- Page 39 and 40:
General introduction substrate to s
- Page 41 and 42:
General introduction mm (Spirlet et
- Page 43 and 44:
Growth models General introduction
- Page 45 and 46:
. The logistic function for asympto
- Page 47 and 48:
d. The von Bertalanffy curves Gener
- Page 49 and 50:
Y Y 1 Y• 0.8 0.6 0.4 0.2 General
- Page 51 and 52:
Y 1 Y• 0.8 0.6 Y•êH1+bL 0.4 0.
- Page 53 and 54:
YY 3 2.5 2 1.5 1 0.5 General introd
- Page 55 and 56:
Table 1. Models used to fit sea urc
- Page 57 and 58:
General introduction model 1 for Ec
- Page 59 and 60:
General introduction method used. I
- Page 61 and 62:
General introduction Experiments in
- Page 63 and 64:
Aim of the thesis 62
- Page 66 and 67:
PART I: SET UP OF AN EXPERIMENTAL R
- Page 68 and 69:
Land-based closed-cycle echinicultu
- Page 70 and 71:
Aquaculture of echinoderms, includi
- Page 72 and 73:
6b. exploitation KCl water renewal
- Page 74 and 75:
earing cycle into seven stages is e
- Page 76 and 77:
(Grosjean et al, 1996, see Part III
- Page 78 and 79:
output. The quality of gametes is o
- Page 80 and 81:
average value of 19.5 days, a minim
- Page 82 and 83:
individuals were still alive 3 mont
- Page 84 and 85:
e. Discussion show similar GI and M
- Page 86 and 87:
The success of the present method l
- Page 88 and 89:
Fenaux (1990) for the same species
- Page 90 and 91:
encountered with food is its stabil
- Page 92 and 93:
to Christine Spirlet (ref. ERB 4001
- Page 94:
PART II Measurement for size in the
- Page 97 and 98:
Part II: Measurement for size in th
- Page 99 and 100:
Few studies have compared and discu
- Page 101 and 102:
d. Results and discussion The ambit
- Page 103 and 104:
Reproducibility of measurements The
- Page 105 and 106:
e. Conclusions fresh weight! Cautio
- Page 107 and 108:
principal axis 3 1 0.8 0.6 0.4 0.2
- Page 109 and 110:
a relative homogeneous growth of al
- Page 111 and 112: 110
- Page 113 and 114: Part III: Experimental studies of t
- Page 115 and 116: assumption of normality can be test
- Page 117 and 118: occurred. From this moment on, and
- Page 119 and 120: d. Results Size distribution among
- Page 121 and 122: Nber of ind. 120 100 80 60 40 20 0
- Page 123 and 124: Table 9. Statistics on the six batc
- Page 125 and 126: Table 10. Size distribution of Fe e
- Page 127 and 128: purpuratus; Dafni & Tobol, 1987: Tr
- Page 129 and 130: Nbr. of ind. Nbr. of ind. A. Size d
- Page 131 and 132: Nbr. of ind. Nbr. of ind. Nbr. d'in
- Page 133 and 134: Part III: Experimental studies of t
- Page 135 and 136: 134
- Page 137 and 138: Part IV: A growth model with intras
- Page 139 and 140: . Introduction fuzzy-remanent funct
- Page 141 and 142: considered factor on the curve's sh
- Page 143 and 144: Diameter D 20 in mm Diameter D in m
- Page 145 and 146: d. Results Theoretical consideratio
- Page 147 and 148: some two-dimensional processes like
- Page 149 and 150: implements this method ('nlrq' pack
- Page 151 and 152: value just after metamorphosis (D0,
- Page 153 and 154: quantifies maximum speed growth, k2
- Page 155 and 156: Table 12. Results of quantile regre
- Page 157 and 158: This way, one obtains a 4-parameter
- Page 159 and 160: individuals related to the presence
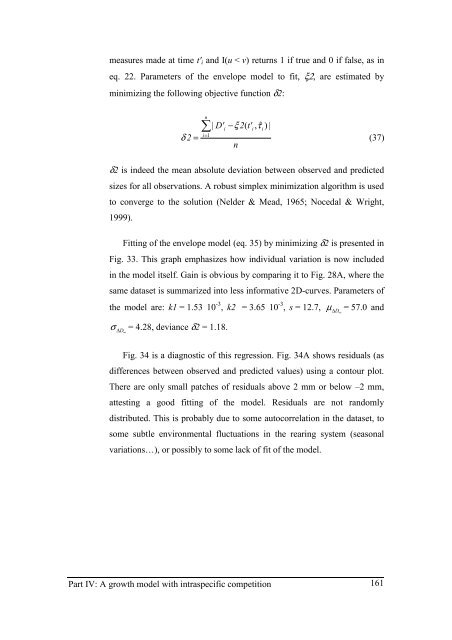
- Page 161: Finally, ∆D∞ should follow a no
- Page 165 and 166: e. Discussion Fig. 34B shows three
- Page 167 and 168: Constraining parameters as we did i
- Page 169 and 170: It does not consider respiration as
- Page 171 and 172: this species. For other species, wh
- Page 173 and 174: ecapture, McDonald & Pitcher, 1979;
- Page 175 and 176: ∆D∞ D0 +∆D∞ − D0 +∆D∞
- Page 177 and 178: evaluated on basis of biological kn
- Page 179 and 180: ain conceptualizes complex objects.
- Page 181 and 182: 180
- Page 183 and 184: General conclusions individuals, wh
- Page 185 and 186: Root models: y’ = ay m -by n (exp
- Page 187 and 188: General conclusions - The diauxic g
- Page 189 and 190: General conclusions model not on a
- Page 191 and 192: References Baker, T.T., R. Lafferty
- Page 193 and 194: References Dafni, J. & R. Tobol, 19
- Page 195 and 196: References Ebert, T.A., 1999. Plant
- Page 197 and 198: References intermedius on a rocky s
- Page 199 and 200: References Guillou, M. & Ch. Michel
- Page 201 and 202: References Kobayashi, S. & J. Taki,
- Page 203 and 204: References McDonald, P.D. & T.J. Pi
- Page 205 and 206: References Pouvreau, S., C. Bacher
- Page 207 and 208: References Sellem, F., H. Langar &
- Page 209 and 210: References Stumm, W. & J.J. Morgan,
- Page 211 and 212: References Webster, S.K. & A.C. Gie
- Page 213 and 214:
212
- Page 215 and 216:
Annexes 214
- Page 217 and 218:
# If no graphic device currently op
- Page 219 and 220:
lines(edatq[, 1], predict(edat.025,
- Page 221 and 222:
SimRes
- Page 223 and 224:
Annexes Code of functions required
- Page 225 and 226:
plot(cumsum(dat[,columns[1]])/sum(d
- Page 227 and 228:
for the CI!!! Annexes SEMean
- Page 229 and 230:
} Annexes # - y, a vector of classe
- Page 231 and 232:
plot(x, y, type="l", col=col, lty=l
- Page 233 and 234:
} Annexes } results[i, 1:5]
- Page 235 and 236:
} .value Annexes dimnames(.grad)
- Page 237 and 238:
#{ # # This is adapted from SSasymp
- Page 239 and 240:
Exp.ival
- Page 241 and 242:
SSallo
- Page 243 and 244:
.expr4
- Page 245 and 246:
.expr9
- Page 247 and 248:
. The 'nlrq' package for nonlinear
- Page 249 and 250:
nlrq.control package:nlrq R Documen
- Page 251 and 252:
gradSetArgs[[2]]), call("[", gradSe
- Page 253 and 254:
model.step
- Page 255 and 256:
Annexes 254
- Page 257 and 258:
Annexes 256
- Page 259 and 260:
Annexes metamorphosis. Acquisition
- Page 261 and 262:
Annexes ABSTRACT: The general allom
- Page 263 and 264:
Annexes libitum for 8, 16, 24, 32,
- Page 265 and 266:
Annexes EXECUTIVE SUMMARY: The aim
- Page 267 and 268:
Annexes KEYWORDS: Somatic growth, d
- Page 269 and 270:
Annexes amount of waste produced at
- Page 271 and 272:
Annexes ABSTRACT: Multimodal distri