

Growth model of the reared sea urchin Paracentrotus ... - SciViews
Growth model of the reared sea urchin Paracentrotus ... - SciViews
Growth model of the reared sea urchin Paracentrotus ... - SciViews

Create successful ePaper yourself
Turn your PDF publications into a flip-book with our unique Google optimized e-Paper software.
e. Discussion<br />
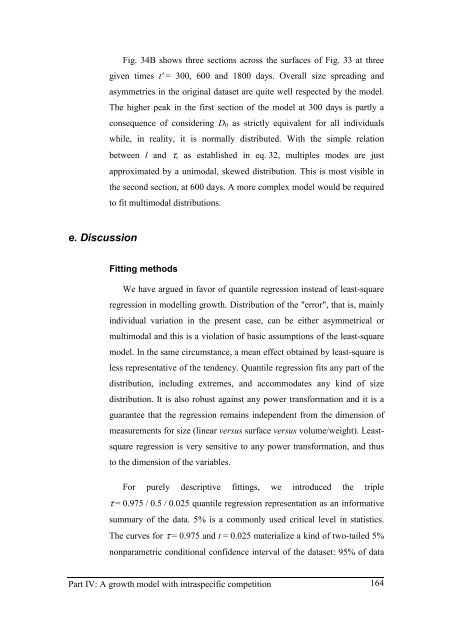
Fig. 34B shows three sections across <strong>the</strong> surfaces <strong>of</strong> Fig. 33 at three<br />
given times t' = 300, 600 and 1800 days. Overall size spreading and<br />
asymmetries in <strong>the</strong> original dataset are quite well respected by <strong>the</strong> <strong>model</strong>.<br />
The higher peak in <strong>the</strong> first section <strong>of</strong> <strong>the</strong> <strong>model</strong> at 300 days is partly a<br />
consequence <strong>of</strong> considering D0 as strictly equivalent for all individuals<br />
while, in reality, it is normally distributed. With <strong>the</strong> simple relation<br />
between l and τ, as established in eq. 32, multiples modes are just<br />
approximated by a unimodal, skewed distribution. This is most visible in<br />
<strong>the</strong> second section, at 600 days. A more complex <strong>model</strong> would be required<br />
to fit multimodal distributions.<br />
Fitting methods<br />
We have argued in favor <strong>of</strong> quantile regression instead <strong>of</strong> least-square<br />
regression in <strong>model</strong>ling growth. Distribution <strong>of</strong> <strong>the</strong> "error", that is, mainly<br />
individual variation in <strong>the</strong> present case, can be ei<strong>the</strong>r asymmetrical or<br />
multimodal and this is a violation <strong>of</strong> basic assumptions <strong>of</strong> <strong>the</strong> least-square<br />
<strong>model</strong>. In <strong>the</strong> same circumstance, a mean effect obtained by least-square is<br />
less representative <strong>of</strong> <strong>the</strong> tendency. Quantile regression fits any part <strong>of</strong> <strong>the</strong><br />
distribution, including extremes, and accommodates any kind <strong>of</strong> size<br />
distribution. It is also robust against any power transformation and it is a<br />
guarantee that <strong>the</strong> regression remains independent from <strong>the</strong> dimension <strong>of</strong><br />
measurements for size (linear versus surface versus volume/weight). Leastsquare<br />
regression is very sensitive to any power transformation, and thus<br />
to <strong>the</strong> dimension <strong>of</strong> <strong>the</strong> variables.<br />
For purely descriptive fittings, we introduced <strong>the</strong> triple<br />
τ = 0.975 / 0.5 / 0.025 quantile regression representation as an informative<br />
summary <strong>of</strong> <strong>the</strong> data. 5% is a commonly used critical level in statistics.<br />
The curves for τ = 0.975 and t = 0.025 materialize a kind <strong>of</strong> two-tailed 5%<br />
nonparametric conditional confidence interval <strong>of</strong> <strong>the</strong> dataset: 95% <strong>of</strong> data<br />
Part IV: A growth <strong>model</strong> with intraspecific competition<br />
164