

Growth model of the reared sea urchin Paracentrotus ... - SciViews
Growth model of the reared sea urchin Paracentrotus ... - SciViews
Growth model of the reared sea urchin Paracentrotus ... - SciViews

Create successful ePaper yourself
Turn your PDF publications into a flip-book with our unique Google optimized e-Paper software.
Biomass variations (Fig. 19, same batch as in Fig. 18) are correlated to<br />
both <strong>the</strong> survival rate and <strong>the</strong> growth speed <strong>of</strong> <strong>reared</strong> echinoids. The higher<br />
mortality observed in winter overrides growth speed, and biomass tends to<br />
decrease slightly. Summer biomass is highest during <strong>the</strong> third and <strong>the</strong><br />
fourth years in this case. The first peak <strong>of</strong> biomass (around 3.5 years old in<br />
<strong>the</strong> figured case, between 2.8 and 3.5 years old for <strong>the</strong> o<strong>the</strong>r batches<br />
depending on <strong>the</strong> <strong>sea</strong>son) corresponds to reaching <strong>of</strong> <strong>the</strong> minimal market<br />
size by more than 90% <strong>of</strong> <strong>the</strong> individuals and seems to be <strong>the</strong> best time to<br />
commercialize <strong>the</strong>m after conditioning <strong>the</strong>ir gonads (stage 6a) from a strict<br />
biological point <strong>of</strong> view. At that time, between 35 and 40 kg <strong>of</strong> fresh<br />
weight <strong>sea</strong> <strong>urchin</strong>s are produced in a single batch. This represents an overall<br />
yield per surface unit <strong>of</strong> <strong>the</strong> growth structures <strong>of</strong> 4 to 7 kg / m 2 <strong>of</strong><br />
toboggans / year. To obtain this result, roughly 400 kg <strong>of</strong> kelp was<br />
provided to <strong>the</strong> <strong>sea</strong> <strong>urchin</strong>s. Thus, over-all food conversion efficiency lies<br />
around 10%.<br />
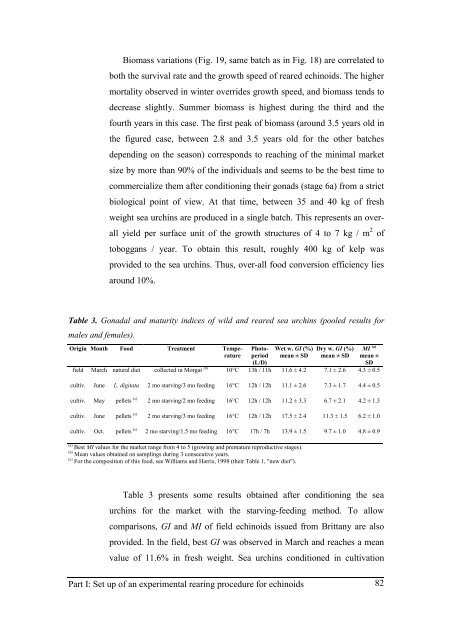
Table 3. Gonadal and maturity indices <strong>of</strong> wild and <strong>reared</strong> <strong>sea</strong> <strong>urchin</strong>s (pooled results for<br />
males and females).<br />
Origin Month Food Treatment Tempe-<br />
rature<br />
field March natural diet collected in Morgat (b)<br />
Photoperiod<br />
(L/D)<br />
Wet w. GI (%)<br />
mean ± SD<br />
Part I: Set up <strong>of</strong> an experimental rearing procedure for echinoids<br />
Dry w. GI (%)<br />
mean ± SD<br />
MI (a)<br />
mean ±<br />
SD<br />
10°C 13h / 11h 11.6 ± 4.2 7.1 ± 2.6 4.3 ± 0.5<br />
cultiv. June L. digitata 2 mo starving/3 mo feeding 16°C 12h / 12h 11.1 ± 2.6 7.3 ± 1.7 4.4 ± 0.5<br />
cultiv. May pellets (c)<br />
cultiv. June pellets (c)<br />
cultiv. Oct. pellets (c)<br />
2 mo starving/2 mo feeding 16°C 12h / 12h 11.2 ± 3.3 6.7 ± 2.1 4.2 ± 1.3<br />
2 mo starving/3 mo feeding 16°C 12h / 12h 17.5 ± 2.4 11.3 ± 1.5 6.2 ± 1.0<br />
2 mo starving/1.5 mo feeding 16°C 17h / 7h 13.9 ± 1.5 9.7 ± 1.0 4.8 ± 0.9<br />
(a) Best MI values for <strong>the</strong> market range from 4 to 5 (growing and premature reproductive stages).<br />
(b) Mean values obtained on samplings during 3 consecutive years.<br />
(c) For <strong>the</strong> composition <strong>of</strong> this food, see Williams and Harris, 1998 (<strong>the</strong>ir Table 1, "new diet").<br />
Table 3 presents some results obtained after conditioning <strong>the</strong> <strong>sea</strong><br />
<strong>urchin</strong>s for <strong>the</strong> market with <strong>the</strong> starving-feeding method. To allow<br />
comparisons, GI and MI <strong>of</strong> field echinoids issued from Brittany are also<br />
provided. In <strong>the</strong> field, best GI was observed in March and reaches a mean<br />
value <strong>of</strong> 11.6% in fresh weight. Sea <strong>urchin</strong>s conditioned in cultivation<br />
82