

Growth model of the reared sea urchin Paracentrotus ... - SciViews
Growth model of the reared sea urchin Paracentrotus ... - SciViews
Growth model of the reared sea urchin Paracentrotus ... - SciViews

You also want an ePaper? Increase the reach of your titles
YUMPU automatically turns print PDFs into web optimized ePapers that Google loves.
plot(cumsum(dat[,columns[1]])/sum(dat[,columns[1]])*100, type="s",<br />
col=cols[1],...)<br />
for (i in 1:length(columns-1)) {<br />
lines(cumsum(dat[,columns[i]]/sum(dat[,columns[i]])*100),<br />
type="s", col=cols[i])<br />
}<br />
} else { # Relative==FALSE<br />
plot(cumsum(dat[,columns[1]]), type="s", col=cols[1],...)<br />
for (i in 1:length(columns-1)) {<br />
lines(cumsum(dat[,columns[i]]), type="s", col=cols[i])<br />
}<br />
}<br />
}<br />
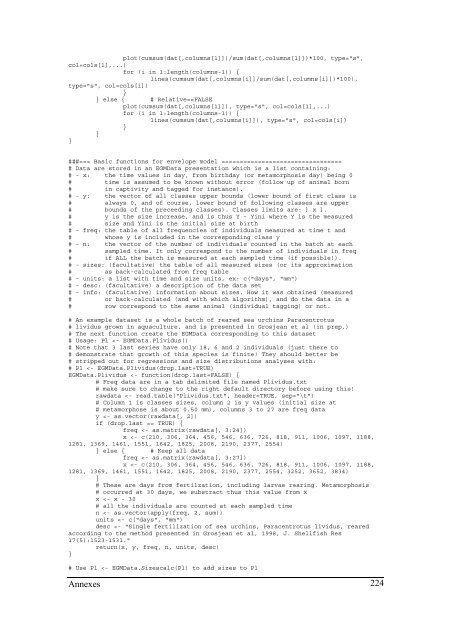
###=== Basic functions for envelope <strong>model</strong> =================================<br />
# Data are stored in an EGMData presentation which is a list containing:<br />
# - x: <strong>the</strong> time values in day, from birthday (or metamorphosis day) being 0<br />
# time is assumed to be known without error (follow up <strong>of</strong> animal born<br />
# in captivity and tagged for instance).<br />
# - y: <strong>the</strong> vector <strong>of</strong> all classes upper bounds (lower bound <strong>of</strong> first class is<br />
# always 0, and <strong>of</strong> course, lower bound <strong>of</strong> following classes are upper<br />
# bounds <strong>of</strong> <strong>the</strong> preceeding classes). Classes limits are: ] x ].<br />
# y is <strong>the</strong> size increase, and is thus Y - Yini where Y is <strong>the</strong> measured<br />
# size and Yini is <strong>the</strong> initial size at birth<br />
# - freq: <strong>the</strong> table <strong>of</strong> all frequencies <strong>of</strong> individuals measured at time t and<br />
# whose y is included in <strong>the</strong> corresponding class y<br />
# - n: <strong>the</strong> vector <strong>of</strong> <strong>the</strong> number <strong>of</strong> individuals counted in <strong>the</strong> batch at each<br />
# sampled time. It only correspond to <strong>the</strong> number <strong>of</strong> individuals in freq<br />
# if ALL <strong>the</strong> batch is measured at each sampled time (if possible!).<br />
# - sizes: (facultative) <strong>the</strong> table <strong>of</strong> all measured sizes (or its approximation<br />
# as back-calculated from freq table<br />
# - units: a list with time and size units, ex: c("days", "mm")<br />
# - desc: (facultative) a description <strong>of</strong> <strong>the</strong> data set<br />
# - info: (facultative) information about sizes. How it was obtained (measured<br />
# or back-calculated (and with which algorithm), and do <strong>the</strong> data in a<br />
# row correspond to <strong>the</strong> same animal (individual tagging) or not.<br />
# An example dataset is a whole batch <strong>of</strong> <strong>reared</strong> <strong>sea</strong> <strong>urchin</strong>s <strong>Paracentrotus</strong><br />
# lividus grown in aquaculture, and is presented in Grosjean et al (in prep.)<br />
# The next function create <strong>the</strong> EGMData corresponding to this dataset<br />
# Usage: Pl