CG malls europe - Commerz Real
CG malls europe - Commerz Real
CG malls europe - Commerz Real

You also want an ePaper? Increase the reach of your titles
YUMPU automatically turns print PDFs into web optimized ePapers that Google loves.
14<br />
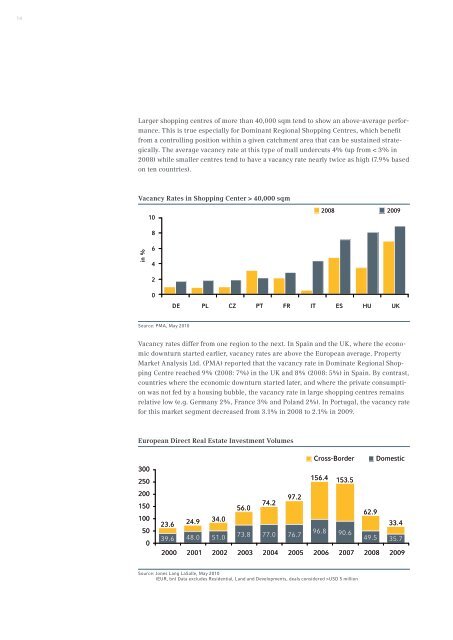
Larger shopping centres of more than 40,000 sqm tend to show an above-average performance.<br />
This is true especially for Dominant Regional Shopping Centres, which benefit<br />
from a controlling position within a given catchment area that can be sustained strategically.<br />
The average vacancy rate at this type of mall undercuts 4% (up from < 3% in<br />
2008) while smaller centres tend to have a vacancy rate nearly twice as high (7.9% based<br />
on ten countries).<br />
Vacancy Rates in Shopping Center > 40,000 sqm<br />
in %<br />
10<br />
8<br />
6<br />
4<br />
2<br />
0<br />
Source: PMA, May 2010<br />
Source: PMA, May 2010<br />
Vacancy rates differ from one region to the next. In Spain and the UK, where the economic<br />
downturn started earlier, vacancy rates are above the European average. Property<br />
Market Analysis Ltd. (PMA) reported that the vacancy rate in Dominate Regional Shopping<br />
Centre reached 9% (2008: 7%) in the UK and 8% (2008: 5%) in Spain. By contrast,<br />
countries where the economic downturn started later, and where the private consumption<br />
was not fed by a housing bubble, the vacancy rate in large shopping centres remains<br />
relative low (e.g. Germany 2%, France 3% and Poland 2%). In Portugal, the vacancy rate<br />
for this market segment decreased from 3.1% in 2008 to 2.1% in 2009.<br />
European Direct <strong>Real</strong> Estate Investment Volumes<br />
300<br />
250<br />
200<br />
150<br />
100<br />
50<br />
0<br />
23.6<br />
39.6<br />
Source: Jones Lang LaSalle, May 2010<br />
(EUR, Source: bn) Data Jones excludes Lang Residential, LaSalle, Land and may Developments, 2010 deals considered >USD 5 million<br />
2008 2009<br />
DE PL CZ PT FR IT ES HU UK<br />
24.9<br />
34.0<br />
48.0 51.0<br />
56.0<br />
74.2<br />
97.2<br />
73.8 77.0 76.7<br />
2000 2001 2002 2003 2004 2005 2006 2007 2008 2009<br />
(EUR, bn) Data excludes Residential, Land and Developments,<br />
deals considered >USD 5 million<br />
Cross-Border Domestic<br />
156.4 153.5<br />
96.8 90.6<br />
62.9<br />
33.4<br />
49.5 35.7